

NCBI Bookshelf. A service of the National Library of Medicine, National Institutes of Health.
Donahue KE, Gartlehner G, Schulman ER, et al. Drug Therapy for Early Rheumatoid Arthritis: A Systematic Review Update [Internet]. Rockville (MD): Agency for Healthcare Research and Quality (US); 2018 Jul. (Comparative Effectiveness Review, No. 211.)
Drug Therapy for Early Rheumatoid Arthritis: A Systematic Review Update [Internet].
Show detailsOrganization of the Results
We first present the results of the literature search and provide a literature flow diagram. In the Characteristics of Included Studies section, we report the distribution of studies by study design and drug therapy group across the Key Questions (KQs). Because most of the included studies provide results for multiple KQs, we describe the study and participant characteristics only once before reporting the KQ-specific results. These characteristics are organized by drug therapy group and drug therapy comparison subgroups. Then, we provide KQ-specific results, which are organized in the same manner. To recap, KQ 1 and KQ 2 deal with benefits of therapy, measured by intermediate or final health outcomes, respectively; KQ 3 focuses on harms of therapy; and KQ 4 addresses issues relating to subpopulations.
Evidence tables that include additional details on study and population characteristics and outcomes appear in Appendix C, followed by study risk of bias (ROB) assessments in Appendix D, outcome-level strength of evidence (SOE) grading details in Appendix E, a description of eligible clinical assessment scales used in our body of evidence and their scoring in Appendix F, detailed test of consistency results for our primary network meta-analyses (NWMA) in Appendix G, the results of supplementary primary NWMA not presented in the main report in Appendix H, and the results of our sensitivity analyses for NWMA in Appendix I.
Search Results
Our electronic searches identified 6,373 citations (Figure 2). We identified an additional 429 citations through other sources; these included the prior report, team member or reviewer recommendations, handsearching of relevant systematic reviews, companion article additions, and supplemental evidence and data received through the Agency for Healthcare Research and Quality (AHRQ) Web site and a Federal Register notice. Following initial removal of duplicate records (details available in Appendix A), a total of 5,287 unique citations underwent title and abstract screening. Of those, 1,628 required full-text review, and 49 studies reported in 124 articles (3% total yield) met our eligibility criteria for inclusion in this review.
Characteristics of Included Studies
In total, 49 studies reported in 124 articles were included; we had 41 randomized controlled trials (RCTs), 4 comparative observational studies, and 4 single-arm observational studies. We grouped studies by the main drug therapy group being evaluated: corticosteroids, conventional synthetic disease-modifying antirheumatic drugs (csDMARDs), targeted synthetic DMARDs (tsDMARDs), tumor necrosis factor (TNF) biologics, non-TNF biologics, biosimilars, and combinations and therapy strategies.
We use Tables 5 through 10 to describe our evidence base and present individual study results. Table 5 presents the distribution of studies by study design and drug therapy group across the KQs. Table 6 presents an overview of important details about our review’s evidence base.
Tables 7, 9, and 10 report major findings from studies used to answer KQ 1, KQ 2, and KQ 3, respectively. Tables 8 and 11 provide a summary of details for all studies used in our KQ 1 and KQ 3 NWMA, including their treatment comparisons and specific outcomes for which they were analyzed. Appendix C provides additional study and population characteristics and outcomes.
Within each drug therapy group, we further categorized studies based on the comparisons that any given study was evaluating (e.g., a csDMARD monotherapy versus a different csDMARD monotherapy). Below, we describe study and patient characteristics for the included studies, grouped by the main drug therapy and then by the comparison(s) the authors made. Patient characteristics were similar by randomized groups; studies with any baseline differences were rated as having a higher risk of bias.
Table 5
Number of studies included for each KQ, by drug therapy group, comparison type, and study design.
Table 6
Characteristics of included studies.
Also within each drug therapy group, we provide the number of studies enrolling samples made up entirely of early RA patients with a disease duration ≤1 year, as well as the number of studies that enrolled mixed populations of patients with early RA.
The range of mean or median disease durations across all 49 included studies was 2 weeks to 12 months. Prior treatment use varied widely across drug therapy categories. Among all 49 included studies, five studies did not report any details about prior treatment use,3–7 leaving 44 studies that did. Of these, 36 enrolled MTX-naïve patient samples, and the remaining eight studies enrolled patients with at least some prior csDMARD use (including MTX).
In four of these eight studies, prior use of any csDMARDs ranged from 13 to 48 percent.19, 20, 26, 93 The other four enrolled samples that were entirely csDMARD resistant.8–11 Among the 15 studies analyzed in our primary or sensitivity NWMA, five enrolled patients with some prior csDMARD use other than MTX,12–16 and three did not report whether patients had used other csDMARDs.7, 17, 18
Five of the eight studies enrolled samples that had previously used MTX specifically: 5819 and 7920 percent of patients in two studies, and three studies (all trials) enrolling samples that were entirely MTX resistant (i.e., 100% prior use).8–10
All included studies enrolled patients with moderate to high disease activity at baseline as measured with mean or median Disease Activity Score (DAS) 28 scores (range of 0 to 10). More than one-half (53% to 83%) of the patient population was women. The mean age range was 46 to 64 years. Study durations ranged from 6 months to 15 years.
Corticosteroids
We included eight RCTs3, 6, 18, 78, 93–96 and one single-arm observational study76 that evaluated corticosteroids. Of the eight RCTs, all contributed results to KQs 1 and 3, and six contributed results to KQ 2. The one single-arm observational study contributed only to KQ 3. Two corticosteroid studies (three articles)78, 93, 97 had been included in the prior report1 (Table 6).
All nine corticosteroid studies enrolled samples consisting entirely of early RA patients with disease duration ≤1 year.3, 6, 18, 76, 78, 93–96
Corticosteroids Versus csDMARDs
Six RCTs compared corticosteroids with csDMARDs (Appendix C). Each took place in various European countries over 2 years (except for one3 that lasted only 1 year). Four trials compared a combination of prednisone (PRED) and MTX versus MTX alone.3, 6, 94, 95, 98, 99 One of these four trials evaluated this comparison in patients at low risk of poor disease prognosis; patients in this trial at high risk of a poor prognosis received additional treatment with either sulfasalazine (SSZ) or leflunomide (LEF) on top of combination PRED and MTX.95, 98 As for the remaining two trials, one evaluated a combination of prednisolone (PNL) and MTX versus MTX alone;93 the other compared a combination of PNL and a csDMARD (mostly MTX or SSZ) versus csDMARD monotherapy.78
Most of the patients in these RCTs were female (60% to 81%), with a mean age between 51 and 62 years. Their disease durations were generally similar and ranged from a mean or median of 2.7 to 6.5 months; one study’s patients had a notably shorter mean duration of less than a month (1.8 to 3.2 weeks).95
Mean baseline DAS values ranged from 3.7 to 5.9, and mean baseline Health Assessment Questionnaire (HAQ) ranged from 1.0 to 1.7. Four studies reported mean baseline Sharp scores: three reported similar mean or median scores ranging from 0.7 to 1.3, but the fourth had notably higher mean scores (4.1 to 4.8) (see Appendix F for a description of scales).
Four studies reported information about prior use of MTX or other csDMARDs.78, 93–95 In the three studies reporting on MTX use, all patients were MTX naïve.78, 94, 95 Among the four studies reporting on prior csDMARD use, three recruited patients who were csDMARD naïve,78, 94, 95 and a small proportion of patients (about 14 percent) in one study had a history of DMARD use.93
High-Dose Corticosteroids
Two RCTs from Belgium and the United Kingdom (lasting 52 to 78 weeks) compared a combination of a high-dose corticosteroid, namely IV methyl-PNL (doses of 250 mg96 or 1 g18), and MTX versus a combination of infliximab (IFX) and MTX.18, 96 Additionally, one study compared the combination of high-dose methyl-PNL and MTX versus MTX monotherapy.18
Most of the trials’ patients were female (67% and 71%, respectively); the mean age of all patients across treatment arms ranged from 50 to 54 years. The disease duration was a median of 1.2 months in the United Kingdom study96 and a mean of nearly 6 months. in the Belgian study.18 Mean baseline DAS ranged from 3.6 to 5.3 across treatment arms.18, 96 Across studies, mean baseline HAQ ranged from 1.3 to 1.5, and the average baseline Sharp score was only reported in one study,96 ranging from 6.1 to 9.2 across treatment arms. Both studies’ patients were entirely MTX naïve, and one18 reported on csDMARD use in general, specifically that its sample was csDMARD naïve.
Corticosteroids: Single-Arm Studies
One study from Sweden (lasting 15 years) evaluated harms associated with oral corticosteroids used for patients with early RA.76 The range of oral corticosteroid doses used by patients was not measured over the course of the study, but rather, only their use or non-use during the first year after RA diagnosis.
Most of the study’s patients were female (69%), with a mean age of 58 years. The mean disease duration was not reported, but all patients’ disease durations were less than 1 year. Median baseline DAS was 5.2, but neither mean baseline HAQ nor Sharp scores were reported. All study participants had no history of prior treatment with MTX or csDMARDs in general.
csDMARD Studies
We included 11 RCTs,4, 15, 21–25, 27, 29, 32, 33 2 comparative observational studies,26, 28 and 4 single-arm observational studies5, 19, 76, 77 that evaluated csDMARDs. All 11 RCTs contributed results to KQs 1, 2, and 3. Overall, we used five of these RCTs in our NWMA. Both comparative observational studies contributed to KQs 1 and 3, but only one28 contributed to KQ 2. Each single-arm observational study contributed only to KQ 3. Six csDMARD studies (12 articles)15, 21–24, 26, 78, 97, 100–104 had also been included in the prior report1 (Table 6). Most of our csDMARD studies (n=8) enrolled mixed populations in terms of RA disease duration.5, 15, 22, 24, 25, 29, 32, 77 The remaining nine enrolled samples were made up entirely of early RA patients with disease duration ≤1 year.4, 19, 21, 23, 26–28, 33, 76
csDMARDs Versus csDMARDs
Seven RCTs4, 21–24, 27, 105 and two single-arm observational studies26, 28 compared csDMARD monotherapies versus either other csDMARD monotherapies or csDMARD combination therapies. Appendix C describes all these studies in detail. The studies took place mainly in European countries; five were based in the Netherlands. Intervention details and characteristics are summarized below by type of csDMARD drug (e.g., monotherapy or combination).
csDMARD Monotherapy Versus csDMARD Monotherapy
One RCT27 and one prospective cohort study28 compared csDMARD monotherapies versus other csDMARD monotherapies. Each took place over 2 to 3 years in Sweden or Norway. The RCT compared the efficacy of two different csDMARDs, MTX versus SSZ, both combined with PRED. The cohort study evaluated the same comparison (MTX versus SSZ), but did not use PRED in combination.
The patients in both studies were similar in terms of demographics: mean ages were approximately 50 and 54 years, and most patients were female (63% and 67%). Only the RCT reported disease duration at baseline, a median of 6 months. Mean baseline DAS was 4.4 and 5.0, and median baseline HAQ 0.5 and 0.9; neither study reported mean Sharp score. In terms of prior treatment history, all patients in both the RCT and observational study were MTX and csDMARD naïve.
csDMARD Combination Therapy Versus csDMARD Monotherapy
We included six RCTs4, 21–24, 105 and one prospective cohort study26 comparing csDMARD monotherapies versus csDMARD combination therapies. Each took place over 1 to 5 years across multiple countries. The RCTs compared the efficacy of multiple csDMARDs combined with each other (plus PNL or other glucocorticoids in four studies4, 22, 24, 105) versus MTX or SSZ monotherapy.4, 21–24, 105 The cohort study compared the combination of SSZ and MTX versus MTX alone.26
Patients varied across studies in terms of demographics: mean ages in the RCTs ranged from 47 to 57 years; the cohort study’s sample had a mean age ranging from approximately 62 to 64 years across treatment arms. Most patients in each study were female (range of 58% to 77%). Disease duration at baseline varied from a mean of 2.3 months to a median of nearly a year (47 weeks). Mean baseline DAS was 3.6 to 5.7, and mean baseline HAQ ranged from 0.9 to 1.4. Four studies reported Sharp scores, which varied considerably across studies from a median of 0 to a mean of 8.9.4, 21, 24, 25
Prior treatment history was reported for MTX use in five of the RCTs21–25 and csDMARD use in three RCTs.21–23 Among these RCTs, all patients were treatment naïve. Only a small proportion of the prospective cohort’s sample reported prior use of csDMARDs (range of 13% to 15% across treatment arms).26
csDMARDs Versus Biologics
Four RCTs compared csDMARD monotherapies versus biologics.7, 15, 32, 33 Three trials were multinational;7, 15, 32 one was based solely in The Netherlands.33 Appendix C summarizes the intervention details and patient characteristics of these trials.
csDMARDs Versus TNF Biologics
One multinational RCT compared the combination of a csDMARD (MTX) and a TNF biologic (adalimumab [ADA]) versus ADA alone and MTX alone. The study took place over 2 years.15
Patients enrolled in this trial had a mean age of approximately 52 years. Most of the sample was female (74.5%). As for prior treatment history, most patients were treatment-naïve, with the entire sample being MTX-naïve and about one-third reporting prior csDMARD use (32%).
csDMARDs Versus Non-TNF Biologics
We included three RCTs comparing csDMARDs with non-TNF biologic monotherapies or combined with csDMARDs. One RCT compared the combination of a csDMARD (MTX) and a non-TNF biologic (abatacept [ABA]) versus ABA alone and MTX alone.7 Two RCTs compared the combination of a csDMARD (MTX) and a non-TNF biologic (tocilizumab [TCZ]) versus TCZ alone and MTX alone. The trials took place over 1 to 2 years.7, 32, 33
Patients in these three trials had mean ages of 47 and 54 years, and most patients were female (range of 67% to 78% across treatment arms). Median disease duration at baseline ranged from 1 to 6 months. Mean DAS scores at baseline were between 5.2 and 6.7 across treatment arms, and mean HAQ scores at baseline were 1.2 to 1.75. Mean Sharp scores varied notably between the only two studies reporting these baseline data, with a median of 0.0 in one33 and means ranging from 5.7 to 7.7 across the other study’s treatment arms.32
Both samples were treatment-naïve in terms of previous MTX or other csDMARD use. Two studies targeted treatment of aggressive early RA.7, 32 In one, 89.5 percent of its sample was rheumatoid factor (RF) seropositive, and its entire sample was experiencing erosive disease.32 In the other trial, 72 percent of the sample was RF seropositive.33
csDMARDs Versus tsDMARDs
One multinational RCT (lasting 1 year) compared the combination of tofacitinib (TOF) and MTX versus TOF alone and MTX alone (Appendix C).29
Patients enrolled in this study had a mean age of approximately 48 to 51 years across treatment arms. Most of the sample was female (about 83%). Mean DAS scores ranged from 6.3 to 6.5 across treatment arms, and the overall mean HAQ score was 1.5. Mean Sharp scores ranged from 12.6 to 13.7 across treatment arms.
As for prior treatment history, very few reported prior MTX use (5.5%), and no information about previous csDMARD use in general was available.
csDMARDs: Single-Arm Studies
Four single-arm studies evaluated harms associated with csDMARDs (Appendix C).5, 19, 76, 77 Study duration varied widely: a mean of 25 weeks in one study,19 a median of 2 years in another,5 about 8 years in a third,77 and 15 years in a fourth.76 Three studies took place in European countries;19, 76, 77 the third was based in Australia.5
Most of the studies’ patients were female (about 67% to 73%), with a mean age of approximately 53 to 60 years. The disease duration was reported by three of these studies5, 19, 77 and ranged from a median of 4 months to approximately 8 months; only one study19 reported a mean disease duration, which was 7.5 months. Information about prior treatment was reported in two studies;19, 76 in one,19 slightly less than one-half of the sample reported prior MTX or csDMARD use, and in the other,76 the entire sample was treatment naïve.
Biologics
We included 22 RCTs and one single-arm study that evaluated TNF and non-TNF biologics. All but one76 contributed results to KQs 1 and 2, all but one41 contributed results to KQ 3, and four reported eligible data for KQ 410, 14, 17, 35 (Appendix C). Five biologic DMARD studies (12 articles)10, 12, 14, 17, 31, 106–112 had also been included in the prior report1 (Table 6).
Most of our trials of biologics (n=12) enrolled mixed populations of early RA patients and those with longer-duration RA.7–9, 12, 14–17, 30–32, 35 The remaining 10 studies enrolled samples made up entirely of early RA patients with disease duration ≤1 year.10, 13, 18, 34, 37, 38, 40, 41, 76, 113
TNF Biologics Versus csDMARDs
We included 16 RCTs comparing TNF biologics versus csDMARDs (Appendix C).9, 10, 12–18, 34, 35, 37, 38, 40, 41, 113 Eight were conducted solely in European countries;9, 10, 16, 18, 34, 40, 41, 113 two were based in Japan13, 35 and one in the United States;14 five were multinational.12, 15, 17, 37, 38 Intervention details and characteristics are summarized below by whether studies used csDMARD monotherapy or combination therapy as the comparator.
TNF Biologic Versus csDMARD Monotherapy
Thirteen RCTs compared TNF biologics versus csDMARD monotherapy.12–18, 34, 35, 37, 38, 41, 103, 113–119 Trials lasted from 6 months to 2 years. Five trials compared a combination of ADA and MTX versus MTX alone.15, 16, 34, 35, 37 One used an MTX dose lower than the dose currently approved by the U.S. Food and Drug Administration.35 Two trials compared etanercept (ETN) versus MTX alone,12, 113 and one evaluated the combination of ETN and MTX versus MTX alone.14 Another three compared a combination of IFX and MTX versus MTX alone.17, 18, 41 Two trials compared a combination of certolizumab pegol (CZP) and MTX versus MTX alone.13, 38 We included nine of these RCTs in our NWMA.
Patients in these trials were mostly female (53% to 81%) with a mean age between 47 years and 54 years. Their mean duration of disease was reported in all but one study and varied from about 2 months to 12 months. Baseline DAS ranged from a mean or median of 5.2 to 6.9, and mean baseline HAQ ranged from 1.0 to 1.9. Mean baseline Sharp scores ranged across studies from 2.4 to 22.
All 13 trials of TNF biologics enrolled samples of MTX-naïve patients, but the proportion of patients reporting other prior treatments differed across studies. Eleven trials reported information about prior treatment, specifically csDMARDs (as a broad category). Four trials enrolled samples of csDMARD-naïve patients,34, 38, 41, 113 five reported that approximately 18 to 54 percent of their patients had taken any csDMARDs,12–14, 35, 37 and one reported that its patients used a mean of 0.2 csDMARDs at baseline.16 The two trials not reporting prior csDMARD use did not differ in a notable way from the other TNF biologic studies.17, 18
TNF Biologic Versus csDMARD Combination Therapy
Three RCTs compared TNF biologics versus csDMARD combination therapy.9, 10, 40, 120–128 Each trial lasted 2 years. All three trials compared a combination of TNF biologics and csDMARDs versus a three- or four-drug combination therapy; however, no trial evaluated the same exact combination. One trial compared a combination of MTX, PRED, hydroxychloroquine (HCQ), and SSZ versus MTX and ADA.9, 120 Another compared the combination of IFX and the FIN-RACo (Finnish Rheumatoid Arthritis Combination Therapy trial) regimen (MTX, PRED, HCQ, and SSZ) versus the FIN-RACo regimen alone.40, 127, 128 The third trial compared triple therapy of MTX, SSZ, and HCQ versus a combination of MTX and IFX.10, 121–126
Patients in these RCTs were mostly female (67% to 79% across treatment arms), with a mean age between 46 and 53 years. Their mean disease durations ranged from approximately 4 to 6 months. Baseline DAS ranged from a mean of 2.5 to 5.6, and mean baseline HAQ ranged from 0.9 to 1.3.
Two trials enrolled patients who had all previously used MTX,9, 10 and patients in the third reported no prior treatment with MTX or csDMARDs.40
TNF Biologics: Single-Arm Studies
One study from Sweden (lasting 15 years) evaluated harms associated with TNF biologics used for patients with early RA.76 This study has also been described previously in the Corticosteroids and csDMARDs sections because it evaluated harms for drugs within those categories.
Most of the study’s patients were female (69%), with a mean age of 58 years. The mean disease duration was not reported, but all patients’ disease durations were less than 1 year. Median baseline DAS was 5.2, but neither mean baseline HAQ nor Sharp scores were reported. All study participants had no history of prior treatment with MTX or csDMARDs in general.
Non-TNF Biologics
Non-TNF Biologic Alone or Plus MTX Versus MTX
Five RCTs compared non-TNF biologics alone or combined with MTX versus MTX monotherapy; each took place over 2 years across multiple countries.7, 30–33, 129–135 Two trials compared combination abatacept (ABA) and MTX versus MTX alone;7, 30, 31, 129, 130, 132, 133, 136 one of these had a third intervention arm for ABA alone.7 Another two trials compared combination tocilizumab (TCZ) and MTX versus MTX alone; both had a third intervention arm for TCZ alone.32, 33, 134, 135 Both were also previously described above in the csDMARDs versus Non-TNF Biologics section. The fifth trial compared different doses of combination rituximab (RIT) and MTX versus MTX alone.30, 132, 133
Most of the individuals enrolled in these RCTs were female (67% to 81% across treatment arms), with a mean age between 47 and 54 years. Participants in two trials had average disease durations of approximately 6 months;7, 31 in another two trials, participants’ average disease durations were about 1 month33 and 3 months;32 and participants in the fifth had an average disease duration of approximately 1 year.30 Across the RCTs, average baseline DAS ranged from 5.2 to 7.1, and average or median baseline HAQ ranged from 1.2 to 1.8. Four of the trials reported average or median baseline Sharp score, which ranged from 5.7 to 7.7,30–32 except in one study whose median Sharp score was 0.0.33 All five trials targeted treatment of aggressive early RA: more than 72 percent of the patients in all five trials were RF seropositive; more than 86 percent in the three trials reported anticyclic citrullinated peptide (anti-CCP) seropositivity were seropositive,7, 31, 33 and 100 percent in two trials reported erosive disease.31, 32
Information about prior treatment for RA was available in four trials.30–33, 134, 135 Only one of these trials reported prior csDMARD use, specifically, in about one-third of its patients (30%).30 All patients enrolled in these four trials were MTX-naïve.
TNF Versus Non-TNF
One RCT (1 year in duration) compared TNF and non-TNF therapies in the United Kingdom.8 It compared RIT and ADA or ETN and addressed KQs 1, 2, and 3.
The mean age of enrolled individuals was 57 years; a majority were female (72%). The average disease duration in the intervention arms ranged from 6.7 to 8.0 months across treatment arms. The average baseline DAS was 6.2; the median baseline HAQ was 1.7 to 1.8. Baseline Sharp score was not reported. This trial targeted treatment of aggressive early RA: 100 percent of participants were either RF or anti-CPP seropositive.
All study participants had prior MTX use; previous use of csDMARDs in general was not reported at all.
Combinations and Therapy Strategies
We included four RCTs and two observational studies that evaluated combination and therapy strategies. All four trials contributed results to KQs 1, 2, and 3; results in the observational studies were limited to KQ 3 (Appendix C). One trial (five articles)79, 83–86 had also been included in the prior report1 (Table 6).
Four studies enrolled mixed populations of early RA patients and those with longer-duration RA.11, 20, 79, 137 Only two studies enrolled samples entirely made up of early RA patients with disease duration ≤1 year.36, 92
These six studies were conducted in Denmark,36 France,92 Ireland and the United Kingdom,137 the Netherlands,79 and the United States.11, 20 The specific combinations and therapy strategies that these researchers compared are described in Appendix C. Study durations ranged from 1 year to 10 years.
Most individuals enrolled in these studies were female (65% to 80%), with a mean age between 46 and 58 years. Two trials reported mean disease duration, which ranged from 2.9 to 4.5 months across treatment arms.20, 36 The other four studies reported median disease duration, which ranged from 23 weeks to 9 months across treatment arms.11, 79, 92, 137
Five studies20, 36, 79, 92, 137 reported mean or median baseline DAS ranging from 4.3 to 6.2, and they also reported mean or median baseline HAQ ranging from 1.0 to 1.7. Four of these studies20, 36, 79, 92 reported mean or median baseline Sharp scores ranging from 2.4 to 7.5 across treatment arms. Only one study did not report baseline DAS, HAQ, or Sharp scores.11 Additionally, a single study targeted treatment of aggressive early RA: 90 percent were RF seropositive and 3 percent were anti-CCP seropositive.20
Regarding prior use of MTX, five studies reported at least some information: four of these enrolled only MTX-naïve patients,36, 79, 92, 137 and only one enrolled some patients with prior MTX treatment (about 20%).20 As for prior use of csDMARDs in general, all six studies of combination and therapy strategies provided some information. Three studies enrolled samples with any prior csDMARD use, varying greatly from study to study (8.5%,79 24%,20 and 100%11), but each of the three remaining studies’ samples was csDMARD naïve.36, 92, 137
KQ 1. Comparative Benefits of Drug Therapies for Patients With Early RA in Relation to Disease Activity, Progression of Radiographic Joint Damage, or Remission
Key Points
- Conclusions below are based on early RA studies including patients with moderate to high disease activity, and the majority were MTX naive.
- Higher remission rates were achieved with a combination of corticosteroids plus MTX than with MTX monotherapy (difference in remission ranges from 2.1% to 42.8% over 18 months to 2 years) (low SOE).
- Combination therapy of corticosteroids plus csDMARDs versus csDMARD monotherapy did not differ significantly in disease activity in the long term (up to 5 years) (low SOE).
- Combination therapy of csDMARDs (predominantly MTX plus SSZ) versus csDMARD monotherapy (MTX) did not differ in ACR50 response or remission (low SOE).
- Evidence was insufficient to compare the impact of csDMARD monotherapy versus csDMARD monotherapy.
- The TNF biologic ADA plus MTX had statistically significantly higher ACR50 response (ACR50 difference 22%), smaller radiographic changes (modified Sharp score difference −3.6), and higher remission rates (difference in remission 24%) than ADA monotherapy (moderate SOE).
- The TNF biologics—ADA, CZP, ETN, or IFX—plus MTX had higher remission rates (difference in remission ranges from 5.6% to 70.0% over 26 weeks to 2 years) (low SOE), and two TNF biologics—CZP and ETN—plus MTX had smaller radiographic changes than MTX monotherapy (difference of mTSS change −0.6 to −2.1 over 24 weeks to 2 years) (low SOE for CZP and moderate SOE for ETN). Evidence was insufficient to compare the impact of ADA or IFX plus MTX versus MTX monotherapy for radiographic changes.
- The non-TNF biologics—ABA, RIT, TCZ—plus MTX had smaller radiographic changes (several radiographic measures used) (low SOE for ABA and moderate SOE for RIT, TCZ) and higher remission rates (difference in remission ranges 18% to 38%) (low SOE for TCZ to moderate SOE for ABA, RIT) than MTX monotherapy.
- Evidence was insufficient to determine any differences between one biologic and another biologic for ACR50 response, remission, or radiographic changes.
- With respect to combination therapy, long-term studies show no differences in remission rates or radiographic change between initial combination versus step-up therapies (moderate SOE).
Detailed Synthesis
Table 7 presents major findings from trials or other studies used to answer KQ 1 on several intermediate outcomes. It is organized essentially as the syntheses below: corticosteroids; csDMARDs and tsDMARDS; biologics; and drug combinations or other strategies for treating patients with early RA.
Because of the dearth of trials directly comparing interventions of interest, we employed network meta-analyses. For KQ 1, we conducted network meta-analyses on the following outcomes: ACR50 response (13 trials), radiographic joint damage (11 trials), remission (10 trials). For NWMA, we focused on a time period around 1 year (52 to 56 weeks) because data were more comprehensive for this time period than for other ones. For other time points, data were insufficient for NWMA, or clinical heterogeneity across trials was too high to derive meaningful estimates from NWMA. We present results of NWMA on ACR50 and radiographic joint damage within each comparison section below; results on remission are presented in Appendix H. For remission, NWMA rendered mostly inconclusive findings with wide confidence intervals.
Table 7
Disease activity, response, and radiographic progression.
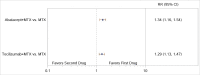
Figure 3 and Figure 4 depict the network diagrams for ACR50 and radiographic joint damage, and Table 8 lists the studies we used in our NWMA of both outcomes. The network structure for both outcomes is mostly “star-shaped” indicating a dearth of head-to-head studies directly comparing interventions. Most effect estimates, therefore, were derived from indirect comparisons relative to MTX, rather than mixed treatment comparisons.
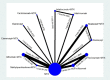
Figure 3
Network diagram for network meta-analysis: ACR50 response rates. ACR50 = American College of Rheumatology 50% improvement; MTX = methotrexate; N = number of patients.
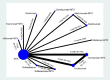
Figure 4
Network diagram for network meta-analysis: change from baseline in radiographic joint damage score. MTX = methotrexate; N = number of patients.
Table 8
Studies included in KQ 1 network meta-analyses.
Corticosteroids
Corticosteroids Versus csDMARDs
Six trials compared the combination of a corticosteroid plus a csDMARD with a csDMARD monotherapy (N=210 to 467) (Table 8).3, 6, 78, 93–95 Study durations ranged from 1 to 2 years of active treatment; four were open label trials and all were medium ROB, except one78 whose 4-year followup data had a high ROB. Treatment arms differed significantly at baseline in terms of patients’ age in one trial,78 but its statistical analyses adjusted for age as a covariate. In another two trials, baseline similarity between arms was unclear.6, 95 The csDMARD under examination was MTX in five trials; one study included SSZ; studies did not report any prior history of MTX use.95 Overall, improvements in disease activity and ACR responses were mixed regarding statistical significance, but they trended toward favoring the treatment combination of corticosteroid plus csDMARD over csDMARD monotherapy.3, 6, 78 The combination of a corticosteroid plus a csDMARD (SSZ or MTX) demonstrated less radiographic progression in most studies measuring this outcome compared with csDMARD monotherapy.78, 93, 94 These positive findings were apparent in studies with longer duration (2 years). Additionally, trials ranging from 1 to 2 years of active treatment had significantly higher remission rates with the combination of a corticosteroid plus MTX than MTX monotherapy (remission rates ranging from 44.8% to 76.7% for combination therapy and 27.8% to 33.3% for MTX monotherapy).3, 6, 78 Overall, higher remission rates were achieved with a combination of corticosteroids plus MTX than MTX monotherapy (low SOE).
High-Dose Corticosteroids
Two trials evaluated the efficacy of high-dose corticosteroids in MTX-naïve populations.18, 96 Both were medium ROB, and in one trial,96 baseline characteristics were similar between treatment arms, and although characteristics differed significantly between arms in the other,18 sensitivity analyses confirmed that those differences had no effect on its findings. The IDEA trial compared the combination of IFX plus MTX with high-dose methylprednisolone (methyl-PNL) plus MTX (N=112).96 In it, a single high dose of methyl-PNL (250 mg) plus MTX was compared with IFX plus MTX over 26 weeks with a 50-week open-label extension. No significant differences were found in ACR50 responses (disease activity) at 26 or 78 weeks, although response rates were high in both groups (64.3% vs. 63.4% at 78 weeks, p=NR). The two groups did not differ statistically in radiographic changes.
Similarly, a study comparing IFX plus MTX versus high-dose methyl-PNL plus MTX versus MTX monotherapy (N=44) found no significant differences between groups in DAS28-CRP, ACR20, ACR50, and ACR70 responses.18 In this study, methyl-PNL was dosed at 1g IV at weeks 0, 2, and 6 and then every 8 weeks for 46 weeks. DAS remission was achieved in 40 percent of MTX-treated patients and 70 percent of the methyl-PNL plus MTX group and IFX plus MTX group but without significant differences (p=NR). Radiographic changes were only measured by MRI-detected erosions. There was more significant progression in MRI-detected erosions in the methyl-PNL group compared with patients treated with IFX plus MTX (p=0.035). Overall, the SOE was insufficient for comparisons of high-dose corticosteroid plus MTX therapy with IFX plus MTX.
csDMARDs
csDMARDs Versus csDMARDs
csDMARD Monotherapy Versus csDMARD Monotherapy
One 2-year trial (N=245) examined SSZ plus prednisolone versus MTX plus prednisolone and found no statistically significant differences in remission rates (defined by a DAS28<2.6) or Larsen score change from baseline (6.2 vs. 4.1, p=0.29).27 Similarly, one 3-year observational study (n=1,102) compared SSZ with MTX and found no statistically significant differences in mean DAS28 after adjusting for baseline characteristics (−1.04 vs. −1.52, p=0.71).28 Both studies in MTX-naïve populations were rated high ROB because of high attrition rates, and in one trial,27 statistically significant baseline differences between treatment arms in RF-positivity and radiographic damage were not accounted for in statistical analyses. Overall, the SOE was insufficient for comparisons between csDMARD monotherapies.
csDMARD Combination Therapy Versus csDMARD Monotherapy
Combination therapy with csDMARDs versus csDMARD monotherapy did not differ significantly in disease activity in the long term (up to 5 years) (low SOE). Six trials compared SSZ plus MTX with csDMARD monotherapy (MTX or SSZ) (overall N=1347).4, 21–24, 105 Study duration ranged from 1 to 5 years and did not report any prior history of MTX use. Randomization within each of these trials was successful in ensuring the similarity of baseline characteristics between treatment arms, although baseline similarity in one trial22 was unclear with regard to DAS and Sharp scores. All trials found no significant differences in disease activity at 1 to 5 years.4, 21–24, 105 Radiographic changes were consistent but imprecise: two trials reported decreased radiographic progression in the combination therapy arms (two csDMARDs [SSZ plus MTX]24 or three csDMARDs [SSZ plus MTX plus HCQ plus prednisolone])22 compared with monotherapy, another two trials did not find any radiologic differences but trended in favor of combination therapy,4, 21 and one trial found no radiologic differences between combination therapy and monotherapy without a trend in favor of either.25, 146, 148
The observational study (n=230) examined the effect of switching to or adding MTX after patients have attempted SSZ.26 These patients were switched to MTX (7.5 mg-30 mg/week) or continued on SSZ and MTX was added. After 1 year, these groups did not differ significantly in disease activity.
csDMARDs Versus Biologics
TNF Biologic: MTX Plus TNF Biologic Versus Monotherapy With Either MTX or TNF Biologic
One RCT provided evidence for direct comparison of a TNF biologic plus MTX versus MTX or TNF biologic monotherapies.15 The PREMIER study15 (N=799) compared MTX (20 mg/week) plus the TNF biologic ADA (40 mg biweekly) with either drug alone in MTX-naïve patients with early aggressive RA (8 or more swollen joints, 10 or more tender joints, elevated sedimentation rate or C-reactive protein, rheumatoid factor positive, or at least one joint erosion). ADA plus MTX had significantly higher ACR50 response, smaller radiographic changes, and higher remission rates than ADA monotherapy (moderate SOE). Significantly more patients on MTX plus ADA achieved an ACR50 response than did patients receiving monotherapy with either MTX or ADA (59%, 43%, 37%, p<0.001) at 2 years. Patients in the ADA plus MTX group had also higher remission rates (49%, 25%, 25%, p<0.001). Additionally, the combination therapy group had lower radiographic progression (modified Sharp/van der Heijde score [mTSS]: 1.9, 5.5, 10.4; p<0.001). During the 10-year open-label extension,118 patients taking ADA plus MTX had significantly less radiographic progression than those on monotherapy, but results were limited by a 34 percent overall attrition rate.
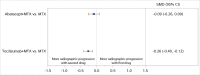
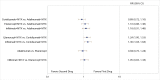
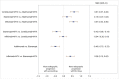
Results of the NWMA were consistent with the findings of the PREMIER study and favored the combination of MTX plus ADA versus ADA monotherapy for higher ACR50 response (relative risk [RR], 1.52; 95% confidence interval [CI], 1.28 to 1.80) and less radiographic progression (standardized mean difference [SMD], −0.38; 95% CI, −0.55 to −0.21) (Figure 5 for ACR50 and Figure 6 for radiographic joint damage). NWMA also favored the combination of MTX plus ETN versus ETN for higher ACR50 response (RR, 1.57; 95% CI, 1.23 to 2.02) (Figure 5). No comparisons were available for CZP, golimumab (GOL), or IFX. For ACR50 data and radiographic joint damage, Figure 5 and Figure 6 show the forest plots. The network structure for both outcomes is mostly “star-shaped,” indicating a dearth of head-to-head studies directly comparing interventions. Most effect estimates, therefore, were derived from indirect comparisons relative to MTX rather than mixed treatment comparisons.
![Figure 5 displays a forest plot for the network meta-analysis of studies reporting ACR50 response rates. Two comparisons were used in this analysis. Study-level data used in this Figure are presented in Appendix C. This figure is described further in the KQ1 Results section “TNF Biologic: MTX Plus TNF Biologic vs. Monotherapy With Either MTX or TNF Biologic” as follows: “Results of the NWMA were consistent with the findings of the PREMIER study and favored the combination of MTX plus ADA versus ADA monotherapy for higher ACR50 response (relative risk [RR], 1.52; 95% confidence interval [CI], 1.28 to 1.80). NWMA also favored the combination of MTX plus ETN versus ETN for higher ACR50 response (RR, 1.57; 95% CI, 1.23 to 2.02)”.](/books/NBK524949/bin/ch4f4.gif)
![Figure 6 displays a forest plot for the network meta-analysis of studies reporting change from baseline in radiographic joint damage score. One comparison was used in this analysis. Study-level data used in this Figure are presented in Appendix C. This figure is described further in the KQ1 Results section “TNF Biologic: MTX Plus TNF Biologic vs. Monotherapy With Either MTX or TNF Biologic” as follows: “Results of the NWMA were consistent with the findings of the PREMIER study and favored the combination of MTX plus ADA versus ADA monotherapy for higher ACR50 response (relative risk [RR], 1.52; 95% confidence interval [CI], 1.28 to 1.80) and less radiographic progression (standardized mean difference [SMD], −0.38; 95% CI, −0.55 to 0.21)”.](/books/NBK524949/bin/ch4f5.gif)
Non-TNF Biologic: MTX Plus Non-TNF Biologic Versus Monotherapy With Either MTX or Non-TNF Biologic
One RCT, the multinational AVERT study (n=351), compared the combination of MTX (7.5mg/week) plus ABA (125 mg/week) with ABA monotherapy and also MTX monotherapy (prior MTX use not reported).7 This double-blind RCT compared treatments over 1 year; at year 2, patients with DAS28-CRP <3.2 were tapered off treatment. If patients experienced an RA flare by month 15, they were given MTX plus ABA. At 1-year (before treatment was withdrawn), patients in the MTX plus ABA group had significantly higher remission (DAS<2.6: 60.9% vs. 42.5% vs. 45.2%, p=0.010) rates than the MTX-only comparison group. Remission rates remained higher for MTX plus ABA than for MTX monotherapy groups following withdrawal at 18 months (14.8% vs. 7.8%, p=0.045).
Two RCTs assessed differences in efficacy between an MTX plus TCZ combination and either MTX or TCZ monotherapy in MTX-naïve populations.32, 33 MTX plus the non-TNF biologic TCZ led to smaller radiographic changes (low SOE) and higher remission rates than MTX monotherapy (moderate SOE). The FUNCTION tria132 examined an MTX plus TCZ combination over 1 year in 1,162 patients with early aggressive RA (moderate to severe active RA classified by ACR criteria). After 1 year, 49 percent in the MTX plus TCZ (8 mg/kg/month) combination, 19.5 percent in the MTX monotherapy, and 39.4 percent in the TCZ monotherapy group achieved remission (p<0.001) (low SOE). Similar findings were noted for the FUNCTION trial at 2 years, but this trial was rated high ROB because of high overall attrition.134 The U-Act-Early trial33 examined 317 patients with early RA over 2 years. Patients were randomized to MTX (10-30 mg/week) plus TCZ (8 mg/kg/month), MTX monotherapy, and TCZ monotherapy. At the primary outcome time point of 24 weeks, MTX plus TCZ and TCZ monotherapy led to higher DAS28 remission than MTX (86% vs. 83% vs. 48%, p<0.001). MTX plus TCZ and TCZ monotherapy also trended toward higher remission at 2 years than MTX, but the difference was not significant (86% vs. 88% vs. 77%, respectively, p=0.06). Both trials reported less radiographic progression with MTX plus TCZ than with MTX monotherapy.
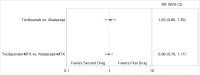
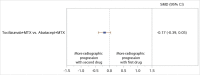
NWMA favored the combination of MTX plus TCZ over TCZ monotherapy for ACR50 response but was not statistically significant (RR, 1.08; 95% CI, 0.96 to 1.21) (Figure 7), and there were no significant differences in radiographic progression (SMD, −0.03; 95% CI, −0.17 to 0.11) (Figure 8). Similarly, the combination of MTX plus ABA was favored over ABA for ACR50 response, but the difference was not statistically significant (RR, 1.18; 95% CI, 0.95 to 1.47) (Figure 7). No comparisons were available for RIT or sarilumab (SAR).
csDMARDs Versus tsDMARDs: MTX Plus tsDMARD Versus Either MTX or tsDMARD
One RCT (n=109) compared the combination of tofacitinib (TOF, 10 mg twice daily) plus MTX (20 mg/week) with monotherapy of TOF or MTX over 12 months in MTX-naïve patients with early RA.29 At 12 months, the TOF plus MTX group reached higher improvements in disease activity (DAS28-4 ESR [Disease Activity Score in 28 joints with 4 variables including erythrocyte sedimentation rate] <3.2) than either of the monotherapy groups receiving only TOF or MTX (58.8% vs. 30.6% vs. 18.9%, p<0.001); the combination group also experienced higher remission rates (DAS28-4 ESR <2.6: 35.3%, 19.4%, 13.5%; p<0.05). Finally, radiographic changes (mTSS) were smaller for the combination group than for monotherapy with either TOF or MTX (−0.15, 0.85, 0.71; p<0.05). Overall, the SOE was insufficient for comparisons of MTX plus tsDMARD with either MTX or tsDMARD.
Biologics
TNF Biologics
TNF Biologic Versus csDMARD Monotherapy
Thirteen RCTs compared a TNF biologic with csDMARD monotherapy. Nearly all of these trials reported baseline similarity of patient characteristics between treatment arms, with the exception of one trial34 in which differences existed in terms of age, physical functional capacity, and Sharp joint space narrowing score. These differences contributed only partially to an elevated ROB rating.34 These trials examined the question of whether adding a TNF biologic improves outcomes in csDMARD users. TNF biologics examined included all TNF biologics except GOL —ADA, CZP, ETN, and IFX. Overall, the TNF biologics (ADA, CZP, ETN, and IFX) plus MTX have smaller radiographic changes and higher remission rates than MTX monotherapy (low SOE).
Adalimumab. Five RCTs, one of which was previously described in the csDMARDs versus TNF biologics section, examined the combination of ADA (40 mg biweekly) plus MTX (ranging from 8 to 20 mg/week) with MTX monotherapy over 26 weeks to 2 years.13, 15, 34–37, 103, 114–119, 150–152, 160–163 Results were mixed: four trials showed improvements in disease activity, and five trials showed smaller radiographic changes for the combination of ADA plus MTX; two trials showed no significant differences but trended in favor of combination therapy. One trial did not report any data about radiographic progression.16 The trials showing differences were conducted over a shorter period (26 weeks), whereas the longer trials did not. NWMA found higher ACR50 responses and less radiographic progression for ADA plus MTX combination therapy than for MTX (RR, 1.35; 95% CI, 1.15 to 1.59, and SMD, −0.99; 95% CI, −1.17 to −0.81, respectively) (Figure 9 for ACR50 and Figure 10 for radiographic joint damage).
Overall, the SOE for comparisons of ADA plus MTX with MTX monotherapy was low for remission and insufficient for disease activity and radiographic changes.
The HIT HARD trial (n=387) was a 48-week trial of combination ADA (40 mg biweekly) plus MTX (15 mg/week) compared with ADA or MTX monotherapy in MTX-naïve patients in private rheumatology practices, hospitals, and university departments throughout Germany.34 ADA was given 40 mg subcutaneously every other week over 24 weeks. Although patients on combination therapy had significant reductions in disease activity (DAS28) at week 24, the differences in clinical outcomes were not significant at week 48 (3.2 vs. 3.4, p=0.4).
The HOPEFUL 1 trial randomized 334 MTX-naïve Japanese patients with early RA to ADA (40 mg biweekly) plus MTX (6 to 8 mg/week) to MTX monotherapy.35 After 26 weeks, remission rates (DAS28<2.6) were significantly higher for combination therapy than with MTX only (31% vs. 14.7%, p<0.001).
The largest trial, OPTIMA,37, 151, 152 was a phase 4 multinational trial that randomized 1,032 early RA patients that were MTX naïve to ADA (40 mg biweekly) plus MTX (7.5 to 20 mg/week) or MTX for 26 weeks (period 1). After period 1 (26 weeks), patients receiving combination ADA plus MTX had significantly higher ACR50 response rates (52% vs. 34%, p<0.001) and significantly lower mean Sharp/van der Heijde Method for Scoring Radiographs (SHS) radiographic changes (0.15 vs. 0.96, p<0.001).
The PREMIER study,15 previously described above in the csDMARDs vs. Biologics section (N=799) compared MTX (20 mg/week) plus the TNF biologic ADA (40 mg biweekly) with either drug alone in MTX-naïve patients with early aggressive RA. Significantly more patients on MTX plus ADA achieved an ACR50 response than did patients receiving monotherapy with either MTX or ADA (59% vs. 43% vs. 37%, p<0.001) at 2 years. Patients in the ADA plus MTX group had also higher remission rates (49% vs. 25% vs. 25%, p<0.001). Additionally, the combination therapy group had lower radiographic progression (modified Sharp/van der Heijde score [mTSS]: 1.9 vs. 5.5 vs. 10.4; p<0.001). During the 10-year open-label extension,118 patients taking ADA plus MTX had significantly less radiographic progression than those on monotherapy, but results were limited by a 34 percent overall attrition rate.
The PROWD study,16 rated high ROB, also found similar improved disease activity with ADA plus MTX combination therapy in 148 MTX-naïve patients but no significant differences in ACR50 response rates and remission at 56 weeks.
Certolizumab pegol. Two RCTs examined the combination of CZP plus MTX versus MTX monotherapy in MTX-naïve patients.13, 38 The C-OPERA trial (N=316), conducted in Japan,13, 153 randomized patients with early RA with poor prognostic factors (high anti-CCP antibody, positive RF, or bony erosions) to CZP, 400 mg biweekly for 4 weeks, then 200 mg biweekly, plus MTX (up to 20 mg/week) or to MTX only. ROB was medium at 24 weeks but high at 52 weeks and 2 years because of high attrition. At 24 weeks, patients in the CZP plus MTX group had significantly higher DAS28 ESR remission rates (52.8% vs. 30.6%, p<0.001) and significantly lower radiographic progression (modified SHS mean change 0.26 vs. 0.88, p=0.003). Similar findings were noted at 2 years.
The second trial, C-EARLY, a 52-week multinational trial38, 39 (n=879) of patients also with poor prognostic factors found significantly higher ACR50 response for patients on CZP (400 mg biweekly) plus MTX (up to 25 mg/week) (61.8% vs. 52.6%, p=0.023) and significantly higher DAS28-ESR remission (42.6% vs. 26.8%, p<0.001) than MTX monotherapy. Additionally, the CZP plus MTX group had a significantly higher proportion of patients with no radiographic progression by mTSS from baseline (70.3% vs. 49.7%, p<0.001).
In the NWMA, higher ACR50 response rates and less radiographic progression were also noted for CZP plus MTX combination therapy than MTX monotherapy (RR, 1.20; 95% CI, 1.04 to 1.38, and SMD, −0.38; 95% CI, −0.53 to −0.23, respectively) (Figure 9 for ACR50 and Figure 10 for radiographic joint damage).
Overall the SOE for comparisons of CZP plus MTX with MTX monotherapy was low for disease activity, remission, and radiographic changes.
Etanercept. Three trials compared ETN (25 mg twice weekly or 50 mg weekly) with MTX in MTX-naïve patients.12, 14, 113 The COMET trial included 542 patients with early RA over 2 years.12, 108, 109, 154–156 Patients were randomized into four groups: (1) ETN plus MTX for 2 years (ETN-MTX/ETN-MTX), (2) ETN plus MTX for year 1 followed by ETN alone in year 2 (ETNMTX/ETN), (3) MTX for year 1 followed by ETN plus MTX in year 2 (MTX/ETN-MTX), or (4) MTX for 2 years (MTX/MTX). Patients in the ETN plus MTX group had a significantly higher ACR50 response than MTX monotherapy at 52 weeks (70.7% vs. 49.0%, p<0.001). Remission was also significantly higher in the ETN plus MTX group (DAS remission <2.6; 51.3% vs. 27.8%, p<0.0001). After 2 years, remission remained higher for patients in the ETNMTX/ETN-MTX group compared with the MTX/MTX group (57.0% vs. 35.0%, p=0.002).
The Enbrel Early RA (ERA) trial found no significant difference in ACR20 response rates (65.0% vs. 72.0%, p=0.16) or radiographic changes at the primary outcome of 12 months, but the 1-year open-label extension found higher ACR20 response rates for ETN than for MTX (72.0% vs. 59.0%; p=0.005).14, 36, 110–112
The third trial113 did not find any significant differences in DAS28 between groups (3.2 vs. 3.1, p=0.53) but was of shorter duration (24 weeks) and smaller sample size (n=26).
Overall, the SOE for comparisons of ETN plus MTX with MTX monotherapy was moderate for disease activity and radiographic changes and low for remission.
In the NWMA, higher ACR50 response rates and less radiographic progression were also noted for ETN plus MTX combination therapy than MTX monotherapy (RR, 1.49; 95% CI, 1.27 to 1.74, and SMD, −0.81; 95% CI, −0.98 to −0.63, respectively) (Figure 9 for ACR50 and Figure 10 for radiographic joint damage).
Infliximab. Three trials examined the combination of IFX with MTX compared with monotherapy in MTX-naïve patients.17, 18, 41 The ASPIRE trial (n=1,049) compared the efficacy of initiating two different combinations of IFX (3 mg/kg or 6 mg/kg) and MTX or MTX (20 mg/week) monotherapy over 54 weeks.17, 106, 107 At 54 weeks, ACR response proportions were significantly improved for both IFX plus MTX combination therapy groups compared with MTX monotherapy (ACR50: 45.6% vs. 50.4% vs. 31.1%, p<0.001 for both IFX comparisons with MTX). Patients treated with IFX plus MTX also had higher rates of remission (DAS28 ESR <2.6; 21.3% for IFX combination therapy groups vs. 12.3%, p<0.001)106 and less radiographic progression (modified SHS change: 0.4 to 0.5 for IFX combination therapy groups, 3.7, p<0.001).17
The smaller second trial (n=20) found significantly improved ACR50 responses at 54 weeks (IFX plus MTX: 78%, MTX: 40%, p<0.05) but no significant differences in radiographic progression.41 After 54 weeks, corticosteroids were permitted as clinically required. However, at 2 years, there were no significant differences in ACR50 response rates or radiographic changes (SHS scores).
The third trial, also small (n=44) and previously described in the High-Dose Corticosteroids section, found a trend in greater improvement for IFX plus MTX compared with MTX monotherapy in ACR20, 50, or 70, but it was not significant at 1 year between groups (results reported in graph only).18
In the NWMA, IFX plus MTX combination therapy also led to higher ACR50 response rates and less radiographic progression than MTX monotherapy (RR, 1.57; 95% CI, 1.30 to 1.88, and SMD, −0.42; 95% CI, −0.58 to −0.27, respectively) (Figure 9 for ACR50 and Figure 10 for radiographic joint damage).
Overall, the SOE for comparisons of IFX plus MTX with MTX monotherapy was low for remission and insufficient for disease activity and radiographic changes.
TNF Biologic Versus csDMARD Combination Therapy
One trial with ADA9 and two trials with IFX10, 40 examined the role of TNF biologics compared with that of csDMARD combinations. Overall, results were mixed.
Adalimumab. The IMPROVED trial (N=161) was a multicenter randomized single-blind trial comparing a combination of ADA (40 mg biweekly) with MTX (25 mg/week), HCQ (400 mg/day), SSZ (2 g/day), and PRED (7.5 mg/day) plus MTX (25 mg/week) in patients who were inadequate responders to MTX.9, 120, 158 Initially, all patients were treated with MTX (25 mg/week) and a tapered high dose of PRED from 60 mg to 7.5 mg/day. Patients who were not in early remission (DAS 1.6 or higher) were randomized into the two treatment groups. After 2 years, no significant differences were observed for disease activity (DAS mean change: 2.0 vs. 1.9, p=0.45), remission (DAS <1.6: 26.5% vs. 30.8%, p=0.76), or radiographic progression (mTSS progression >0.5: 10.8% vs. 6.4%, p=0.31). Overall, the SOE for comparisons of ADA plus MTX with csDMARD combination therapy is insufficient for disease activity, remission, and radiographic changes.
Infliximab. The SWEFOT trial10, 121–126 was a multicenter randomized trial (n=258) in Sweden comparing IFX (3 mg/kg) plus MTX with MTX (20 mg/week) plus SSZ (2 g/day) plus HCQ (400 mg/day) over 1 year in patients who were inadequate responders to MTX. Initially, 487 patients were enrolled and placed on MTX for 3 to 4 months; those who did not achieve low disease activity were randomized to the above therapies. After 1 year, the IFX plus MTX combination group had significantly higher ACR50 response rates (25.0% vs. 14.6%, p=0.042). However, in a 2-year followup study of MTX naïve patients,122 ACR50 response rates were not significantly different between groups. The 2-year followup results from the NEO-RACo trial comparing IFX plus the FIN-RACo regimen of MTX (25 mg/week) plus SSZ (1 to 2 g/d) plus HCQ (35 mg/kg/week) plus PRED (7.5 mg/day) with the FIN-RACo regimen no significant differences in ACR50, remission (61% vs. 60%, p=0.93) or radiographic progression (SHS mean: 5.3 vs., p=0.54) at 5-year followup.40, 127, 128 Overall, the SOE for comparisons of IFX plus MTX with csDMARD combination therapy is low for disease activity.
Non-TNF Biologics
Non-TNF Biologic Plus MTX Versus Either Non-TNF Biologic or MTX
Abatacept. The AGREE trial was a multinational trial of early RA patients (98% MTX naïve) with poor prognostic factors (n=509) that compared the combination ABA (10 mg/kg days 1, 15, and 29 and then every 4 weeks) plus MTX (7.5 mg/week) with MTX only over 2 years.31, 129–131 The first year was a double-blind trial; in year 2, patients in the combination therapy (ABA plus MTX) continued treatment and ABA was initiated in the MTX-only group. After 1 year, the ABA plus MTX group had significantly higher ACR50 response than the MTX-only group (57.4% vs. 42.3%, p<0.001). The ABA plus MTX group also had significantly higher remission rates (41.4% vs. 23.3%, p<0.001) and less mean radiographic changes (Genant-modified Sharp score 0.63 vs. 1.06, p=0.040). Less radiographic progression was noted at 2 years for the original ABA plus MTX group compared with progression for the original MTX-only group.130
The multinational AVERT study (n=351), previously described in the csDMARDs versus non-TNF biologics section, also compared the combination of ABA (125 mg/week) plus MTX (7.5 mg/week) with ABA monotherapy and also MTX monotherapy (prior MTX use not reported).7 Overall, the non-TNF biologic ABA plus MTX had smaller radiographic changes (low SOE) and higher remission rates (moderate SOE) than MTX monotherapy.
The NWMA found significant differences in ACR50 response when comparing ABA plus MTX with MTX monotherapy (RR, 1.34; 95% CI, 1.16 to 1.54), consistent with the results from the AGREE and AVERT trials (Figure 11). The combination of ABA plus MTX had numerically less radiographic progression than MTX monotherapy, but the difference was not significant (SMD, −0.09; 95% CI, −0.26 to 0.09) (Figure 12).
Rituximab. The IMAGE trial30, 132, 133 (n=755) randomized MTX-naïve patients to RIT (1 g days 1 and 15) plus MTX (7.5 mg-20 mg/week) combination therapy, RIT (500 mg days 1 and 15) plus MTX (7.5 mg to 20 mg/week) combination therapy, and MTX monotherapy over 52 weeks. Both RIT plus MTX groups and the RIT monotherapy group had significantly improved disease activity (DAS28: −3.21 vs. −3.05 vs. −2.06, p<0.001) and remission rates (31% vs. 25% vs. 13%, p<0.0010) and less radiographic change (0.36 vs. 0.65 vs. 1.08, p<0.001 compared with MTX monotherapy). Overall, the non-TNF biologic RIT plus MTX had smaller radiographic changes (moderate SOE) and higher remission rates (moderate SOE) than MTX monotherapy.
In the NWMA, TCZ plus MTX showed higher ACR50 response rates and less radiographic progression than MTX monotherapy (RR, 1.29; 95% CI, 1.13 to 1.47, and SMD, −0.26; 95% CI, −0.40 to −0.12, respectively) (Figure 11 for ACR50 and Figure 12 for radiographic joint damage). There were no NWMA comparisons with RIT or SAR.
Tocilizumab. Two RCTs, the FUNCTION trial32 (N=1,162) and the U-Act-Early trial33 (N=317), both previously described in the csDMARD versus non-TNF biologic section, assessed differences in efficacy between a TCZ plus MTX combination and either MTX or TCZ monotherapy in MTX-naïve populations. In both trials, the non-TNF biologic TCZ plus MTX led to smaller radiographic changes (moderate SOE) and higher remission rates (low SOE) than MTX monotherapy after 1 to 2 years.
Biologic Head to Head: TNF Versus Non-TNF
The ORBIT trial, an open-label noninferiority RCT (n=329), compared the non-TNF, RIT (1 g days 1 and 15) with TNF, ADA (40 mg biweekly), or ETN (50 mg/week) over 1 year.8 Patients had a prior inadequate response to at least two csDMARDs. Despite attempting two treatments, the mean disease duration was 6.7 to 8.0 months. No significant differences were found for disease activity (DAS28 ESR mean change: −2.6 vs. −2.4, p=0.24) or remission (DAS28 remission: 23% vs. 21%, p=NR). Radiographic progression was not reported. Overall, the SOE for the comparison of TNF with non-TNF therapies was insufficient.
In the NWMA below (Figure 13 for ACR50 and Figure 14 for radiographic joint damage), TNF therapy (monotherapy or with MTX) is compared with non-TNF therapy (monotherapy or with MTX). No comparisons were significant, except for a lower ACR50 response rate for ADA compared with TCZ (RR, 0.75; 95% CI, 0.58 to 0.95). Less radiographic progression was noted with ADA plus MTX (SMD, −0.90; 95% CI, −1.15 to −0.65) and CZP plus MTX (SMD, −0.29; 95% CI, −0.53 to −0.06) than ABA plus MTX. Less radiographic progression was also noted with ADA plus MTX than TCZ plus MTX (SMD, −0.73; 95% CI, −0.96 to −0.50).
TNF Versus TNF
No direct evidence was available for comparisons of TNF biologics with TNF biologics. The SOE for all indirect estimates was low (downgrading for indirectness and imprecision in all cases). NWMA of ACR50 response rates found no significant differences in comparisons with ADA plus MTX versus CZP plus MTX, ETN plus MTX, or IFX plus MTX. IFX plus MTX had higher ACR50 response rates than CZP plus MTX, but the confidence interval was large (RR, 1.30; 95% CI, 1.04 to 1.64) (Figure 15). Radiographic progression was less for ADA plus MTX compared with IFX plus MTX (SMD, 0.57; 95% CI, 0.33 to 0.80) and CZP plus MTX (SMD 0.61; 95% CI, 0.37 to 0.84). ADA monotherapy also had less radiographic progression than ETN monotherapy (SMD, −0.49; 95% CI, −0.75 to −0.23). Radiographic progression was less for ETN plus MTX compared with CZP plus MTX (SMD, −0.42; 95% CI, −0.66 to −0.19) and IFX plus MTX (SMD, 0.38; 95% CI, 0.15 to 0.62) (Figure 16).
Non-TNF Versus Non-TNF
No direct evidence was available for comparisons of non-TNF biologics with non-TNF biologics. The SOE for all indirect estimates was low (downgrading for indirectness and imprecision in all cases). In NWMA of ACR50 response and radiographic progression, comparisons of TCZ (with or without MTX) versus ABA (with or without MTX) found no significant differences between groups (low SOE) (Figure 17 and Figure 18, respectively).
Combinations and Therapy Strategies
With respect to combination therapy, long-term studies show no differences in remission rates between initial combination versus step-up therapies (moderate SOE). The BeSt study randomized 508 MTX-naïve patients with early RA to one of four groups: (1) sequential DMARD, starting with MTX (15 mg/week); (2) stepped-up combination therapy with MTX (15-30 mg/week) followed by SSZ (2 g/day), HCQ, and PRED; (3) initial combination therapy of MTX, SSZ, and tapered high-dose PRED (60 mg/day to 7.5 mg/day in 7 weeks); and (4) initial combination therapy with MTX (25-30 mg/week) and IFX (3 mg/kg every 8 weeks; doses titrated up to 10 mg/kg dependent on DAS >2.4).79–91 The design called for frequent changes in drug strategy; therapeutic strategies were adjusted every 3 months when the DAS was greater than 2.4. At 12 months, higher proportions in group 3 (MTX, SSZ, PRED) and group 4 (MTX and IFX) reached a DAS of 2.4 or less (group 1: 53%; group 2: 64%; group 3: 71%; and group 4: 74%, p=0.004 for group 1 vs. group 3, p=0.001 for group 1 vs. group 4: p=NS for other comparisons).79 The median increase in total SHS radiographic scores was 2.0, 3.5, 1.0, and 0.5 in groups 1 through 4 (p<0.001),79 suggesting that initial combination therapies resulted in less radiographic damage. At 4 years, remission rates were similar among the groups (DAS <1.6: 50%, 41%, 38%, 42%, p=0.40).86 Similarly, there were no significant differences among the groups in remission at 10 years (51.0%, 49.0%, 53.0%, 53.0%, p=0.94). There were also no significant differences in joint damage at 10 years (mTSS: 11.0, 8.0, 8.0, 6.0, p=0.15)
The GUEPARD study92 first randomized MTX-naïve patients to 3 months of ADA plus MTX or MTX monotherapy. In patients who at 3 months did not respond to an initial strategy, investigators examined whether disease activity–driven treatment with TNF inhibitors was equally effective in controlling clinical symptoms and structural damage in both groups. At 3 months, there was an initial numerical improvement in ACR50 response (66% vs. 27%, p=NR), but there were no differences at 1 year between groups. Similarly, there were no differences in radiographic changes between groups. We rated this study high ROB after 12 weeks because of the risk of contamination bias given that patients could be switched to different dosing and treatment regimens when low disease activity was achieved at 12 weeks and beyond (both groups received the same treatments).
Similarly, the OPERA trial36, 160–163 of 180 early RA patients in Danish hospital-based clinics using a treat-to-target protocol found no significant differences in disease activity or remission between combination therapy (ADA plus MTX) and monotherapy (MTX) (DAS28 CRP [Disease Activity Score based on C-Reactive Protein]<2.6 remission: 66% vs. 69%, p=0.79).
The TEAR study20, 159 randomized MTX-naïve patients (n=755) to four treatment arms: (1) immediate treatment with MTX plus ETN; (2) immediate treatment with MTX plus SSZ plus HCQ (triple therapy); (3) step-up from MTX to MTX plus ETN when DAS28-ESR (Disease Activity Score 28 using erythrocyte sedimentation rate) was 3.2 or higher at week 24; and (4) step-up from MTX to triple therapy when DAS28-ESR was 3.2 or higher at week 24. The four treatment groups did not differ significantly in DAS28-ESR between week 48 and week 102 (reported in figure only, p=0.48). Similarly, radiographic score changes (mTSS) did not differ significantly between step-up therapy and immediate therapy. Radiographic progression was significantly lower among patients randomized to MTX plus ETN than among those receiving triple therapy (0.64 vs. 1.69, p=0.047). We rated this trial as high ROB because overall discontinuation rates were high (up to 42 percent).
KQ 2. Comparative Benefits of Drug Therapies for Patients With Early RA in Relation to Patient-Reported Symptoms, Functional Capacity, or Quality of Life
To address this KQ, we had a total of 41 studies (40 RCTs and 1 observational study). Details of individual studies are documented in the Evidence Table in Appendix C; some information about the specific investigations that had also addressed KQ 1 can be found in the “Characteristics of Included Studies” section above.
Table 9 presents data on all these investigations for the three main outcomes of concern for KQ 2: patient-reported symptoms, functional capacity (sometimes denoted as function or physical function), and quality of life (typically health-related quality of life, or HRQOL). Functional capacity was the most commonly measured outcome. HAQ-DI was the most common outcome measure reported for physical function. The accepted minimally clinically important difference (MCID) for HAQ-DI in RA is a change of 0.22-0.25.165 HRQOL was sometimes assessed, and 36-item Short Form Health Survey (SF-36) Physical Component Score (PCS) and SF-36 Mental Component Score (MCS) were the most common outcome measures reported for HRQOL. The accepted MCID for the SF-36 PCS in RA is 4.4, and for the SF-36 MCS, it is 3.1.166, 167 Patient-reported symptoms were only rarely reported. Appendix F provides more information about the scales and their meanings.
Key Points
- Conclusions below are based on early RA studies including patients with moderate to high disease activity, and the majority were MTX naive.
- Evidence was insufficient to determine the impact of corticosteroids plus csDMARDs versus csDMARD monotherapy on functional capacity or health-related quality of life (HRQOL).
- Combinations of TNF biologics plus MTX produced statistically significantly greater improvements in functional capacity than MTX alone. The differences in HAQ-DI exceeded the minimally clinically important difference in most studies. This finding applied to the following TNF biologics: ADA (difference of HAQ change −0.1 to −0.3 over 24 weeks to 2 years) (moderate SOE), CZP (difference of HAQ change not consistently reported, but in favor of combination therapy, over 30 weeks to 1 year) (low SOE), and IFX (difference of HAQ change not consistently reported, but in favor of combination therapy, over 30 weeks to 1 year) (low SOE). Evidence was inconclusive for the TNF biologic ETN (low SOE). Evidence was insufficient to determine the impact on HRQOL of adding TNF biologics to MTX therapy.
- The TNF biologic IFX plus a combination of csDMARDs (triple therapies—MTX, SSZ, HCQ, plus prednisone [PRED]) did not differ significantly from the same combination of csDMARDs alone in their impact on functional capacity (low SOE). Evidence was insufficient to determine whether ADA plus MTX or IFX plus MTX differed from csDMARD triple therapy in their effects on functional capacity.
- Combination of RIT (non-TNF biologic) plus MTX produced statistically significantly greater improvements in functional capacity than MTX alone (HAQ decrease >0.22: 88% and 87% vs. 77%, p<0.05) (moderate SOE).
- Evidence was insufficient to evaluate any differences between one biologic and another biologic for their impact on either functional capacity or HRQOL.
- Combination strategies using multiple csDMARDs or csDMARD plus TNF biologics compared with sequential or step-up therapies did not differ significantly in terms of functional capacity (low SOE). Evidence was insufficient to determine the impact of these strategies on HRQOL.
Table 9
Results for patient-reported outcomes, functional status, and quality of life.
Detailed Synthesis
Corticosteroids
Corticosteroids Versus csDMARDs
Evidence was insufficient to determine whether patients treated with corticosteroids plus csDMARDs versus csDMARD monotherapy differed on functional capacity or HRQOL. Five RCTs (n=1,329 eligible) compared a combination of a corticosteroid plus a csDMARD with csDMARD only and were eligible for this Key Question; four examined functional capacity or quality-of-life outcomes (or both),78, 93–95 and one3 examined patient-reported symptoms only (Table 9). Two studies added prednisolone (PNL) to either MTX93 or SSZ;78 two studies examined adding prednisone (PRED) to MTX,3, 94 two studies added PRED to SSZ,95 and one study added PRED to leflunomide (LEF).95
The duration and dose of PRED varied among studies. Doses ranged from 7.5 mg per week to taper schedules starting at 60 mg per week. The duration and dosing of PNL also varied, with a dose of 7.5 mg per day in one study78 and a taper schedule starting at 60 mg per day in another.93 Overall, improvements in functional capacity were mixed. Three studies demonstrated significant improvements78, 93, 94 and one showed no difference.95
In the CAMERA-II trial,94 functional capacity as measured by HAQ mean difference improved significantly more at 2 years in the PNL plus MTX group than in the MTX monotherapy group (HAQ mean difference, −0.18; 95% CI, −0.34 to −0.02) (p=0.027). It should be noted that the difference of at least 0.20 is considered to represent a clinically significant change (Appendix F). Similar statistically significant differences were found at 3, 6, 12, and 18 months. In the BARFOT #2 trial,78 physical function as measured by mean decrease in HAQ improved significantly more from baseline in the PNL plus csDMARD group than in the csDMARD monotherapy group at 3, 6, 12, and 18 months and 2 years (p=0.003); the difference was still present in the followup at 4 years (p=0.034). In the CARDERA trial,93 at 2 years, functional capacity did not differ between the PNL plus MTX group and MTX monotherapy group (HAQ mean change, −0.28 vs. −0.27, p=NR, respectively). In the CareRA trial,95 functional capacity did not differ among the groups at 16 weeks and 54 weeks as measured by clinically meaningful change in HAQ. In the CareRA trial,95 functional capacity did not differ significantly among the groups at 16 weeks and 54 weeks as measured by clinically meaningful change in HAQ.
One RCT93 evaluated HRQOL outcomes. The investigators found no significant differences between PNL plus MTX and MTX monotherapy in either the physical or the mental subscale of the 36-Item Short-Form Health Survey (SF-36) or the EuroQoL standardized instrument (EQ-5D) (p=0.22).
One RCT3 evaluated patient-reported symptoms and found significantly greater improvement in pain as measured with a Visual Analogue Scale (VAS) in the PRED plus MTX group compared with the MTX monotherapy group at 4 months (p=0.01) and 12 months (p=0.04).
High-Dose Corticosteroids
Two RCTs evaluated the efficacy of high-dose corticosteroids in MTX-naïve populations. In the IDEA trial (N=112), a single high dose of methyl-PNL (250 mg IV) plus MTX was compared with IFX plus MTX over 26 weeks with a 50-week open-label extension.96 Groups did not differ in functional capacity at 26 and 78 weeks, as measured by mean change in HAQ-Disability Index [DI] (at 78 weeks, −0.85 vs. −0.79; p=0.826). The second study (N=44)18 compared IFX plus MTX versus high-dose methyl-PNL (1 g IV at weeks 0, 2, and 6 and then every 8 weeks for 46 weeks) plus MTX versus MTX monotherapy. At 52 weeks, this study found significantly greater HAQ improvements over time in the methyl-PNL plus MTX group than in the MTX group (p=0.001).
csDMARDs
csDMARDs Versus csDMARDs
csDMARD Monotherapy Versus csDMARD Monotherapy
One RCT (N=245) compared MTX plus PNL with SSZ plus PNL. Functional capacity did not differ significantly at 2 years between groups (HAQ mean change from baseline, −0.35 vs. - 0.38; p=0.752).27
One observational study compared SSZ (2 g/d) with MTX (10-15 mg/wk) monotherapy. At 6 months, functional capacity improved significantly in the MTX group compared with the SSZ group (modified HAQ mean change from baseline, −0.26 vs. −0.13; p=0.002).28 However, this difference was not significant after adjusting for propensity score quintile and physician global VAS. HRQOL outcomes did not differ between groups as measured by mean change from baseline values on the SF-36 physical and mental component subscales. There was no significant difference in patient-reported pain or fatigue as measured by VAS mean change from baseline between groups. Of note, both the RCT and observational study used MTX dosing that is lower (5-15 mg weekly) than typically recommended as efficacious (20-25 mg weekly).
csDMARD Combination Therapy Versus csDMARD Monotherapy
Six RCTs (N=1,347) compared combination csDMARD therapy with csDMARD monotherapy. Four trials examined the combination SSZ plus MTX versus csDMARD monotherapy (MTX or SSZ).21, 23–25 Two other trials examined the combination of MTX plus SSZ plus HCQ against csDMARD monotherapy with different PRED doses.4, 22 Trial durations ranged from 1 to 5 years. Doses of MTX were variable, ranging from 7.5 mg weekly to 25 mg weekly.
All six trials found no significant differences in functional capacity between the combination csDMARD group and the csDMARD monotherapy at 1 to 5 years.4, 21–25 One trial found significant improvement in functional capacity in the combination csDMARD group at 28 weeks, measured as a mean change in HAQ (−1.1 vs. −0.6, p<0.0001), but this difference was not sustained at either 52 weeks or 5 years.24 This same trial found greater improvement in patient-reported pain (VAS, mean change -34 vs. -20, p<0.002) in the combination csDMARD group compared with the csDMARD monotherapy group at 28 weeks but no difference between groups at 56 weeks. One trial148 found no difference in quality of life over time, measured with the EQ-5D, between the csDMARD combination group and the csDMARD monotherapy group. In the FIN-RACo study,22 patients treated with MTX plus SSZ plus HCQ plus PNL had significantly less work disability at 2 years than patients receiving csDMARD monotherapy (MTX or SSZ) (median work disability per patient-observation years, in days: 12.4 vs. 32.2; p=0.008). In the tREACH trial, patients treated with MTX plus SSZ plus HCQ plus glucorticoids had less unemployment than patients receiving MTX plus glucocorticoids at 12 months (p=0.015).
csDMARDs Versus Biologics
TNF Biologic: MTX Plus TNF Biologic Versus Monotherapy With Either MTX or TNF Biologic
The PREMIER study (N=799) examined the combination of ADA (40 mg biwkly) plus MTX (20 mg/wk) compared with either ADA alone or MTX alone in patients with early aggressive RA.15 At 1 year, the ADA plus MTX group achieved significantly greater improvement in functional capacity than the ADA group (HAQ-DI mean change: −1.1 and −0.8, respectively; p=0.0002).
At 2 years, several outcomes appeared to favor the combination groups. The ADA plus MTX group had more improvement in functional capacity than the MTX group (HAQ-DI mean change, −1.0 vs. −0.9; p<0.05). Additionally, significantly more patients in the ADA plus MTX group had a HAQ-DI score of 0 than did those in either monotherapy group (33% vs. 19% vs. 19%; p<0.001). The ADA plus MTX group had a greater improvement in quality-of-life outcomes than the MTX group based on the physical subscale of the SF-36 (PCS) but not the mental subscale (MCS); the ADA-only group had statistically higher improvements than the MTX-only group based on the SF-36 MCS (p=0.0148). The ADA plus MTX group had lower patient-reported pain (mean pain VAS) than the ADA-only group (9.6 vs. 19.6, p<0.0001). There was no difference in patient-reported pain between the ADA-only group and the MTX-only group. Finally, compared with patients in the MTX-only group, patients in the ADA plus MTX group had more gained employment (27.4% vs. 22.7%) and fewer missed work days (mean 17.4 for 130 employed vs. 36.9 for 110 employed).
Non-TNF Biologic: MTX Plus Non-TNF Biologic Versus Monotherapy With Either MTX or Non-TNF Biologic
One trial, the multinational AVERT trial (n=351), compared the combination of ABA (125 mg/week subcutaneous) plus MTX (7.5 mg/week) with ABA monotherapy.7 This double-blind RCT compared treatments over 1 year; at year 2, patients with a DAS28-CRP <3.2 were tapered off treatment. If patients had an RA flare by month 15, they were given ABA plus MTX. The percentage of patients who had HAQ-DI response in the ABA plus MTX group was higher than the percentages in the ABA group at 12 months (65.5% vs. 52.6%) and 18 months (21.8% vs. 16.4%), but these differences were not statistically significant.
Two RCTs compared the combination of TCZ plus MTX with TCZ alone or MTX alone.32, 33 Both trials demonstrated greater functional capacity in the combination TCZ (8 mg/kg) and MTX group than in the TCZ-alone or MTX-alone groups.
In the FUNCTION trial (N=1,162),32 the TCZ (8 mg/kg) plus MTX group achieved a statistically greater improvement in functional capacity than the MTX group (mean change from baseline HAQ-DI −0.81 vs. −0.64 p=0.0024) at 52 weeks. A significantly greater improvement in SF-36 PCS was seen in the TCZ (8 mg/kg) plus MTX group than in the MTX group at 24 weeks (p=0.0014) and at 52 weeks (p=0.0066). By contrast, functional capacity or HRQOL did not differ between the TCZ (4 mg/kg) plus MTX and MTX groups or between TCZ monotherapy and MTX monotherapy groups at either 24 or 52 weeks.
The U-Act-Early trial (N=317) used the Dutch HAQ to assess physical function.33 Significantly greater improvement in functional capacity was demonstrated at 24 weeks in the combination TCZ plus MTX group than in the TCZ-alone or the MTX-alone group at 24 weeks (p=0.0275). This difference was not found at 52 or 104 weeks. Additionally, there was significantly greater improvement in mean SF-36 PCS scores over time in the TCZ plus MTX group and TCZ-alone group than in the MTX-alone group (p=0.044 and p=0.012, respectively). No significant differences were found in SF-36 MCS scores over time between groups. There was also significantly greater improvement in mean EQ-5D scores over time in the TCZ plus MTX group than in the MTX-alone group (p=0.018). There was no significant difference between the TCZ-alone and MTX-alone groups.135
csDMARDs Versus tsDMARDs: MTX Plus tsDMARD Versus Either MTX or tsDMARD
One RCT examined (N=108) the combination of TOF (20 mg/day, higher than the dose typically used) plus MTX (10-20 mg/week) against TOF alone or MTX alone in patients with early active RA.29 It found no significant difference across these groups n functional capacity improvement, as measured by HAQ-DI improvement from baseline >0.22, at 3, 6, or 12 months.29
Biologics
TNF Biologics
TNF Biologic Versus csDMARD Monotherapy
Thirteen RCTs examined whether adding a TNF biologic improved outcomes in csDMARD users. The TNF biologics included were ADA, CZP, ETN, and IFX. No eligible trial or study was found for GOL. All involved a csDMARD (typically MTX) as the comparison group. The time frames of these trials differed considerably. Most of our 13 trials suggested greater improvement in functional capacity with a combination TNF biologic and csDMARD than with csDMARD monotherapy.12, 13, 15–18, 34, 35, 37, 41, 103, 114–119, 150–152 This finding applied to the following TNF biologics: ADA (difference of HAQ change −0.1 to −0.3 over 24 weeks to 2 years) (moderate SOE), CZP (difference of HAQ change not consistently reported, but in favor of combination therapy, over 30 weeks to 1 year) (low SOE), and IFX (difference of HAQ change not consistently reported, but in favor of combination therapy, over 30 weeks to 1 year) (low SOE). Evidence was insufficient to determine the impact on HRQOL of adding TNF biologics to MTX therapy. The results of the trials reporting HRQOL outcomes were mixed. Several trials demonstrated improvement in SF-36 PCS scores;12, 17, 34, 36 none showed improvement in other measures.
One trial comparing ETN monotherapy with MTX monotherapy showed no significant difference in mean HAQ scores at 12 months but greater improvement in functional capacity at 24 months in the ETN monotherapy group (open-label extension).14
Adalimumab. Five RCTs compared ADA (40 mg biweekly) plus MTX (ranging from 8 to 20 mg/week) with MTX monotherapy.13, 15, 16, 34–37, 103, 114–119, 150–152, 160–163 The HIT HARD trial demonstrated clinically significantly greater functional capacity in the ADA and MTX group than in the MTX group at 24 weeks (mean HAQ-DI, 0.49 vs. 0.72; p=0.0014).34 At 24 weeks, scores on the SF-36 PCS were significantly higher for higher scores in ADA plus MTX patients than MTX-only patients (44 vs. 39.8, p=0.0002) but patients in these two groups did not differ on the SF-36 MCS. At 48 weeks, the trial detected no differences in functional capacity and HRQOL.
In the HOPEFUL 1 trial,35 the ADA plus MTX group experienced a clinically significant larger improvement in physical function than the MTX group (decrease from baseline mean HAQ-DI score, 0.6 vs. 0.4; p<0.001); in addition, significantly more patients in the ADA plus MTX than in the MTX group achieved normal functionality (HAQ-DI score <0.5, 60.0% vs. 36.8%; p=0.001) at 26 weeks.
The OPTIMA trial was a phase 4 multinational RCT comparing ADA plus MTX with MTX in early RA.37, 151, 152 At 26 weeks, the study demonstrated clinically significant greater functional improvements in the ADA plus MTX group than in the MTX group (HAQ-DI mean score, 0.7 vs. 0.9; p<0.001); in addition, a significantly greater proportion of ADA plus MTX patients than MTX-only patients demonstrated normal function (40.0% vs. 28.0%, respectively; p<0.001). In post hoc analysis,152 the ADA plus MTX group had significant improvement in work-related outcomes at 26 weeks compared with the outcomes in the MTX group (patients receiving ADA plus MTX showed significant changes in percentage points from baseline compared with patients receiving MTX in activity impairment, presenteeism, and overall work impairment [32.0% vs. 23.7%, 24.6% vs. 17.1%, 27.3% vs. 18.3%, respectively]). In patients who had achieved low disease activity at 26 weeks, the two therapy groups did not differ in physical functional score at 78 weeks.
The PREMIER study (N=799), also described previously in the csDMARDs versus Biologics section, examined the combination of ADA plus MTX compared with MTX alone in patients with early aggressive RA.15 At 1 year, the ADA plus MTX group achieved clinically significant greater improvement in functional capacity than the MTX group (p=0.0003) (HAQDI mean change: −1.1 and −0.8).
In the PROWD study, the primary outcome was to evaluate work disability in each group.16 At week 16, fewer patients in the ADA plus MTX group than in the MTX group had job loss, (16% vs. 27.3%, p=0.092). At 56 weeks, job loss was significantly lower with ADA plus MTX compared with MTX (18.6% vs. 39.7%, p<0.005). At 56 weeks, the ADA plus MTX patients had significantly greater improvement in function from baseline than the MTX patients (change in mean HAQ, −0.7 vs. −0.4; p=0.005).
Certolizumab. Two RCTs examined the combination of CZP (either 400 mg biweekly for 4 weeks or 200 mg biweekly for 4 weeks, then 200 mg biweekly) plus MTX with MTX only.13, 38, 39 The C-OPERA trial13, 153 randomized 316 patients with early RA with poor prognostic factors (high anti-CCP antibody, positive RF or bony erosions). The CZP plus MTX group experienced a rapid and statistically significant (p<0.05) improvement in HAQ-DI response rate compared with the MTX group at all time points from 4 weeks to 52 weeks. At 104 weeks, HAQ remission rates were higher in the CZP plus MTX group compared with the MTX group but did not meet statistical significance (73% vs. 63.7%, p=0.09).153 The C-EARLY trial38 compared CZP plus MTX with MTX alone in 879 patients with early RA and poor prognostic factors (positive anti-CCP antibody or positive RF) and found a similarly significant greater improvement in functional capacity in the CZP plus MTX group than in the MTX group at 1 year (mean change in HAQ-DI from baseline, −1.00 vs. −0.82, p<0.001). The CZP plus MTX group also had greater improvement in household and work productivity than the MTX group at 52 weeks based on a work productivity scale for RA (WPS-RA). CZP plus MTX patients reported greater improvements versus MTX in household productivity (household work days missed per month baseline vs. week 52: MTX=10.4 vs. 3.0, CZP + MTX=8.8 vs. 1.9; household work days with productivity reduced by ≥50%/month: MTX=10.6 vs. 3.0, CZP + MTX=9.4 vs. 2.1; level of arthritis interference with household work productivity/month: MTX=6.4 vs. 2.5, CZP + MTX=6.0 vs. 1.9). Employed CZP plus MTX patients reported reductions in absenteeism and increases in presenteeism versus MTX (work days missed per month, baseline vs. week 52: MTX=4.0 vs. 0.9, CZP + MTX=4.4 vs. 0.6; days with work productivity reduced per month: MTX=8.8 vs. 1.8, CZP + MTX=6.4 vs. 1.0; level of arthritis interference with work productivity/month: MTX=5.8 vs. 1.9, CZP + MTX=5.5 vs. 1.4).
Etanercept. Three RCTs compared ETN (25 mg twice weekly or 50 mg weekly) with MTX.12, 110, 113 The COMET trial12, 108, 109, 154–156 compared ETN plus MTX with MTX alone. It found a clinically significant greater improvement in functional capacity in the ETN plus MTX group than in the MTX group at 52 weeks (HAQ mean change: −1.02 vs. −0.72, p<0.0001). Significantly more patients in the ETN plus MTX group than in the MTX group achieved normal function (HAQ-D1<0.5) (55% vs. 39%, p=0.0004) at 52 weeks. They also had signficantly higher SF-36 PCS scores (13.7 vs. 10.7, p=0.003), but did not differ from the MTX group in the SF-36 MCS scores. In post hoc analysis, improvement in work-related outcomes was apparent; significantly fewer patients had to stop working (8.6% vs. 24%, p=0.004) and fewer had problems with absenteeism (mean missed workdays: 14.2 vs. 31.9).
In the Enbrel Early RA study, ETN 25 mg twice weekly was compared with MTX over 12 months.110 Physical function did not differ between groups (~55% in each arm had at least a 0.5-unit improvement in HAQ) at 12 months. In the open-label extension from 12 to 24 months, significantly more patients in the ETN group than in the MTX group achieved improvement in function (HAQ improvement >0.5 units: 37% vs. 55%, p<0.001).
A smaller trial (n=26)113 compared ETN 25 mg twice weekly with MTX over 24 weeks and found greater improvement in function in the ETN group than in the MTX group at 12 weeks (HAQ mean change from baseline, 0.9 vs. 0.6; p=NR) but no further improvement seen in either group from 12 to 24 weeks (p=0.38).
Infliximab. Three trials compared the combination of IFX plus MTX with MTX monotherapy.
The ASPIRE trial (n=1,049) was a 54-week trial comparing IFX (3 mg/kg or 6 mg/kg) plus MTX with MTX monotherapy.17, 107, 157 More patients in the IFX 3 mg/kg and 6 mg/kg + MTX groups than the MTX group had clinically significant improvements in HAQ scores from baseline to 54 weeks (percentage of patients with HAQ increase ≥0.22 units from baseline: 76%, 75.5%, 65.2%; p<0.004). The average improvement in physical function from 30 to 54 weeks was significantly greater in the IFX 6 mg/kg plus MTX and IFX 3 mg/kg plus MTX groups than in the MTX monotherapy group (mean decrease in HAQ scores from baseline: 0.88, 0.80, vs. 0.68, p<0.001). At 54 weeks, HRQOL ratings (SF-36 PCS score) were significantly higher in both IFX plus MTX groups than in the MTX group (11.7, 13.2, vs. 10.1; p=0.003). Additionally, this study assessed work disability by patient-reported working capacity, or employability, at baseline and 54 weeks. For this analysis, IFX 3 mg/kg and 6 mg/kg groups were combined. Employability improved significantly in the IFX plus MTX group compared with those outcomes in the MTX group (employability odds ratio [OR] [95% CI]: 2.4 [2.2 to 2.6]; p<0.001) and significantly fewer patients were unemployable (8% vs. 14%, p=0.05). By contrast, it found no significant differences in the change in employment rates between the IFX plus MTX group and the MTX group (0.5% vs. 1.3%; p>0.05). Of note, work disability was a secondary outcome measure in the study.
One small trial (n=20)41 also found a significant functional benefit (by HAQ) at 54 weeks favoring IFX (3 mg/kg at standard intervals) plus MTX over MTX (p<0.05). In the 8-year followup, physical function outcomes did not differ between groups (HAQ median [IQR]: 1.0 [0.1-1.8] vs. 1.5 [1.2-2.1]; p=0.12).
Another small trial (n=44), also described previously in the High-Dose Corticosteroids section, compared IFX 3 mg/kg plus MTX with MTX alone over 1 year.18 Although the IFX plus MTX group experienced a significant improvement in functional capacity (by HAQ) over time, its change in functional capacity did not differ significantly compared with the MTX group (p=NR).
TNF Biologic Versus csDMARD Combination Therapy
The TNF biologic IFX plus the FIN-RACo regimen (a combination of csDMARDs - MTX, HCQ, and SSZ – plus PRED) versus the FIN-RACo regimen alone did not differ significantly in their impact on functional capacity (low SOE). Three RCTs examined the impact of TNF biologics compared with csDMARD combination therapy. One trial evaluated ADA;9, 120, 158 two trials evaluated IFX.10, 40, 121–128 Two trials9, 40, 120 reported functional capacity outcomes; they reported no significant difference in physical function between groups at all time points ranging from 4 months to 5 years. Two studies examined quality-of-life outcomes and found no significant differences between groups.9, 126 One study9 examined patient-reported pain and found significantly lower patient-reported pain in the ADA plus MTX group compared with the combination csDMARD group at 1 year (mean pain VAS, 28 vs. 38, p=0.02) and no significant difference at 8 months. Evidence was insufficient to determine the impact of the TNF biologic ADA or IFX plus MTX versus csDMARD triple therapy on functional capacity.
Non-TNF Biologics
Non-TNF Biologic Plus MTX Versus MTX Monotherapy
Abatacept. Two RCTs evaluated the combination of ABA plus MTX in comparison with MTX alone.31, 129–131 The AGREE trial compared the ABA (10 mg/kg IV) plus MTX (7.5 mg/week) group with the MTX group over 2 years.31, 129–131 We rated this trial as high ROB because overall discontinuation rates were high (up to 42 percent). The first year was a double-blind trial; in year 2, patients in the ABA plus MTX group continued treatment and patients in the MTX-only group were started on ABA. At 1 year, the ABA plus MTX patients had clinically significant greater functional benefit than patients in the MTX group (HAQ-DI % change of >0.3 units from baseline: 71.9% vs. 62.1%, p=0.024). Significant improvements in quality-of-life outcomes occurred in the ABA plus MTX group compared with outcomes in the MTX group; these were assessed by mean changes from baseline in the SF-36 MCS (8.15 vs. 6.34, p=0.046) and the SF-36 PCS (11.68 vs. 9.18, p=0.005).
The multinational AVERT trial (n=351), previously described in the csDMARDs versus non-TNF biologics section, also compared the combination of ABA (125 mg/week subcutaneous) plus MTX (7.5 mg/week) with ABA monotherapy or MTX monotherapy.7 This double-blind RCT compared treatments over 1 year; at year 2, patients with a DAS28-CRP <3.2 were tapered off treatment. If patients had an RA flare by month 15, they were given ABA plus MTX. The percentage of patients in the ABA plus MTX group was higher than the percentages in the MTX group who had HAQ-DI response at 12 months (65.5% vs. 44%) and 18 months (21.8% vs. 10.3%), but these differences were not statistically significant.
Rituximab. One RCT, the IMAGE trial30, 132, 133 (n=755), compared RIT (1 g on days 1 and 15) plus MTX (7.5 mg-20 mg/week) combination therapy, RIT (500 mg on days 1 and 15) plus MTX (7.5 mg to 20 mg/week) combination therapy, and MTX monotherapy over 2 years. At week 52, functional capacity (measured by HAQ-DI decrease >0.22) improved more in the RIT 1 g plus MTX and the RIT 500 mg plus MTX groups than in the MTX-only group (HAQ response, 88% and 87% vs. 77%; p<0.05). This difference remained for the RIT 1 g plus MTX group versus the MTX-only group at 104 weeks (p<0.05). The improvement in SF-36 PCS scores in both RIT plus MTX groups was significantly greater than in the MTX monotherapy group (mean changes in PCS scores, 10.76 and 10.07 vs. 7.24; p <0.0001). The mean changes in SF-36 MCS were not significantly different (6.66 and 6.18 vs. 4.85). There was also significantly greater improvement in patient-reported pain in the RIT plus MTX groups than in the MTX monotherapy group (VAS, mean change, p<0.0001) and in patient-reported fatigue (FACIT-F, mean change, p<0.05) at 52 weeks.
Tocilizumab. Two RCTs, also described previously in the csDMARDs versus Biologics section, compared the combination of TCZ plus MTX with MTX alone.32, 33 Both trials demonstrated greater functional capacity in the combination TCZ (8 mg/kg) and MTX group than in the MTX-alone group.
In the FUNCTION trial (N=1,162),32 the TCZ (8 mg/kg) plus MTX group achieved a statistically greater improvement in functional capacity than the MTX group (mean change from baseline HAQ-DI −0.81 vs. −0.64, p=0.0024) at 52 weeks. A significantly greater improvement in SF-36 PCS was seen in the TCZ (8 mg/kg) plus MTX group than in the MTX group at 24 weeks (p=0.0014) and at 52 weeks (p=0.0066). By contrast, functional capacity or HRQOL did not differ between the TCZ (4 mg/kg) plus MTX and MTX groups at either 24 or 52 weeks.
The U-Act-Early trial (N=317) used the Dutch HAQ to assess physical function.33 Significantly greater improvement in functional capacity was demonstrated at 24 weeks in the combination TCZ plus MTX group than in the MTX-alone group at 24 weeks (p=0.0275). This difference was not found at 52 or 104 weeks. Additionally, there was significantly greater improvement in mean SF-36 PCS scores over time in the TCZ plus MTX group than in the MTX-alone group (p=0.044). No significant differences were found in SF-36 MCS scores over time between groups. This trial also found significantly greater improvement in mean EQ-5D scores over time in the TCZ plus MTX group than in the MTX-alone group (p=0.018). There was no significant difference between the TCZ-alone and MTX-alone groups.135
Biologic Head to Head: TNF Versus Non-TNF
Evidence was insufficient to determine any differences between one biologic and another biologic for either the functional capacity or the HRQOL outcomes. One RCT compared TNF biologics with non-TNF biologics. The ORBIT trial, an open-label noninferiority RCT (n=329) over 1 year, compared the non-TNF RIT (1 g days 1 and 15) with TNF treatment (either ADA (40 mg biweekly) or ETN (50 mg/week).8 Patients had had a prior inadequate response to at least two csDMARDs. Patients in the RIT group had a statistically greater improvement in physical function (mean HAQ change from baseline) than in the TNF group at 6 months (−0.44 vs. −0.31; p=0.0391) and 12 months (−0.49 vs. −0.38; p=0.0391). The EQ-5D and anxiety and depression measures did not differ at 6 months and 12 months.
Combinations and Therapy Strategies
Combination strategies using multiple csDMARDs or csDMARD plus TNF biologics compared with sequential or step-up therapies did not differ significantly in terms of functional capacity (low SOE). Evidence is insufficient to determine the impact of these strategies on HRQOL. Two RCTs20, 83, 85, 159 evaluated combination strategies using corticosteroids plus oral DMARDs or TNF biologics. The results of these studies demonstrated that using combination therapy produced significantly more rapid improvement in functional capacity (difference in mean change in HAQ at 28 weeks, −0.5; p<0.0001) and less work disability (median, 12.4 days per patient-observation year vs. 32.3 days; p<0.008) than oral DMARD monotherapy.
The BeSt RCT examined four different treatment strategies over 12 months.83, 85 Patients treated with initial combination csDMARD therapy plus PRED (group 3) or initial combination therapy plus IFX (group 4) had more rapid improvement in functional ability than those treated with sequential csDMARD therapy (group 1) or with step-up combination therapy (group 2). Statistically significant improvements were reported for 3, 6, 9, and 12 months. By 2 years, all groups maintained their improvements but the groups themselves did not differ significantly. Improvements were also maintained at 4-, 5-, and 10-year followup. Patients in groups 3 and 4 also had more rapid improvement in physical HRQOL, with greater improvements at 3 months and 6 months for groups 3 and 4 than for groups 1 and 2 on the SF-36 PCS (p<0.001). By years 1 and 2, all groups had similar improvement in SF-36 PCS. Mental HRQOL measured by the SF-36 MCS did not differ across groups.
The TEAR study found no significant difference in functional ability at 48 or 102 weeks.20, 159 The comparisons were four groups: immediate combination TNF biologic and csDMARD group (group 1); immediate combination csDMARD group (group 2); step-up from MTX to TNF biologic plus MTX (group 3); and step-up from MTX to combination csDMARD group (group 4).
The GUEPARD study92 compared the initial strategy of ADA (40 mg every 2 weeks) plus MTX (up to 20 mg/wk) with MTX monotherapy for 3 months. In patients who did not respond to an initial strategy at 3 months, the investigators examined whether a disease activity–driven treatment strategy with TNF biologics was equally effective in both groups. At 1 year, there was no difference between groups in functional capacity, SF-36 PCS, or SF-36 MCS scores. There was no difference between groups in patient-reported pain or fatigue at 12 weeks or 1 year. Of note, this study was rated high ROB after 3 months because of the risk of contamination bias based on modifications in treatment dosing and regimens when low disease activity was achieved.
The OPERA trial36, 162 of 180 Danish early RA patients compared ADA (40 mg every 2 weeks) plus MTX (7.5 mg-20 mg) with MTX alone. At 3 months, SSZ or HCQ could be added if disease activity persisted. There was a clinically significant greater improvement in functional capacity at 1 year in patients treated with initial combination therapy (ADA plus MTX) than in monotherapy (MTX) patients (HAQ median change: −0.88 vs. −0.63; p=0.012).36 The improvement in the SF-12 PCS was also greater for the combination than the monotherapy patients (13.2 vs. 10.6; p=0.0150), and the combination group also reported significantly less pain (median VAS score, p=0.007), but there were no differences in change in the SF-12 MCS, the EQ-5D, or fatigue. At 2 years, the groups did not differ in physical function, quality of life, pain, or fatigue.162
KQ 3. Comparative Harms of Drug Therapies for Patients With Early RA in Relation to Harms, Tolerability, Patient Adherence, or Adverse Effects
For this KQ, we use the FDA definition for serious adverse events. These include death, life- threatening experience, hospitalization or prolongation of hospitalization, significant incapacity or inability to conduct normal life functions, congenital anomaly, medical event requiring medical or surgical intervention to prevent one of the prior outcomes. Specific adverse events include 11 most commonly occurring across all our eligible drugs according to their FDA-approved labels. This set of adverse events includes rash, upper respiratory tract infection, nausea, pruritus, headache, diarrhea, dizziness, abdominal pain, bronchitis, leukopenia, and injection site reactions.
Key Points
- Conclusions below are based on early RA studies including patients with moderate to high disease activity, and the majority were MTX naive.
- Clinical trials provided the majority of evidence that was available for this population.
- Corticosteroids and csDMARDs did not differ significantly in serious adverse events (moderate SOE) or discontinuation rates attributable to adverse events (low SOE).
- csDMARD combination therapy compared to csDMARD monotherapy did not differ significantly in serious adverse events (low SOE). Combining a csDMARD with a TNF biologic did not differ significantly in serious adverse events (moderate SOE) or discontinuations attributable to adverse events compared with TNF biologic monotherapy (moderate SOE). Similarly, combining a csDMARD with a non-TNF biologic did not lead to a significant difference in serious adverse events (moderate SOE) or discontinuations attributable to adverse events compared with non-TNF biologic monotherapy (moderate SOE).
- Serious adverse events or discontinuations attributable to adverse events did not differ significantly between the TNF biologics (ADA, CZP, ETN, IFX) in combination with MTX versus MTX monotherapy (low SOE).
- Discontinuations attributable to either adverse events or serious adverse events did not differ significantly between the non-TNF biologics (ABA, RIT, TCZ) in combination with MTX versus MTX monotherapy (low SOE for ABA and moderate SOE for RIT and TCZ).
- Harms evidence was insufficient for head-to-head comparisons of TNF and non-TNF biologics.
- Long-term studies (up to 10 years) of combination strategies using multiple csDMARDs or csDMARD plus TNF biologics ultimately showed no differences in serious adverse events between immediate combination and step-up therapies (low SOE).
Detailed Synthesis
Table 10 presents data on all included trials or observational studies for the four main outcomes of concern for KQ 3: overall discontinuation rates; discontinuations attributable to adverse events; serious adverse events; and occurrence of specific adverse events. All outcomes were reported in percentages.
Table 10
Discontinuation rates and adverse events.
In the detailed synthesis below, we report on these outcomes separately for RCTs and observational studies. The evidence primarily includes RCTs. The results of our NWMA (network diagrams and forest plots) are presented below in figures accompanying the results for specific drug comparisons.
Because of the dearth of trials directly comparing interventions of interest, we employed NWMA. For KQ 3, we conducted NWMA on the following outcomes: all discontinuations (unintended for any reason such as an adverse event, side effect, lack of effectiveness or any other reason to drop out of a study) (16 trials) and discontinuations due to adverse events. For NWMA, we focused on a time period around 1 year (52 to 56 weeks) because data were more comprehensive for this time period than for other ones. For other time points, data were insufficient for NWMA, or the clinical heterogeneity across trials was too high to derive meaningful estimates from NWMA. We detected no significant differences between the consistency and inconsistency models for these two outcomes (see Appendix G for details). Therefore, we report estimates based on the consistency models. We present results of NWMA for all discontinuations and discontinuations because of adverse events within each comparison section below.
Figure 19 depicts the network diagram for both outcomes, and Table 11 lists the studies we used in each NWMA. The network structure is mostly “star-shaped,” indicating a dearth of head-to-head studies directly comparing interventions. Most effect estimates, therefore, were derived from indirect comparisons relative to MTX rather than mixed treatment comparisons. Our NWMA for all discontinuations and for discontinuations attributable to adverse events were reported below. Confidence intervals for the NWMA for discontinuations and discontinuations due to adverse events were wide and should be interpreted with caution.
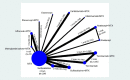
Figure 19
Network diagram for network meta-analysis: All discontinuations and discontinuations due to adverse events. MTX = methotrexate; N = number of patients.
Table 11
Studies included in KQ 3 network meta-analysis.
Corticosteroids
Corticosteroids Versus csDMARDs
Five trials examined overall risk of harms, discontinuation, adherence, serious adverse events, and specific adverse events (Table 10).3, 78, 93–95, 98, 99, 138–140 Many of the csDMARD investigations involved a corticosteroid plus a csDMARD (majority with MTX) compared with csDMARD monotherapy. Corticosteroids and csDMARDs did not differ significantly in serious adverse events (moderate SOE) or discontinuations attributable to adverse events (low SOE). Over 2 years, discontinuation rates in the combination corticosteroid plus csDMARD arm ranged from 8.2 percent to 47.0 percent; in the csDMARD arm, the rates ranged from 10.9 percent to 29.8 percent. Overall, no significant differences were found in discontinuations attributed to adverse events and serious adverse events. The CAMERA-II trial reported nausea significantly less in the PRED plus MTX arm than in the MTX monotherapy arm (19.6% vs. 36.1%, p=0.006).94 Additionally, elevated transaminases occurred less often in the PRED plus MTX arm.94 These could be chance findings because we could not find consistent findings in the other studies. Occurrences of infection did not differ significantly in either the CAMERA-II or the CARDERA trials.93, 94
High-Dose Corticosteroids
Two trials compared the combination of IFX plus MTX with high-dose methyl-PNL and MTX.18, 96 Overall, the SOE was insufficient for discontinuations because of adverse events and serious adverse events. The IDEA trial (N=112)96 lasted for 26 weeks, and then patients were converted to open-label treatment for an additional 50 weeks. The investigators reported no appreciable differences in overall discontinuation and discontinuation attributable to adverse events (5.5% vs. 1.8%, p=NR). However, reported serious adverse events were 36.4 percent in the MTX plus IFX group and 15.8 percent in the high-dose methyl-PNL plus MTX group (p=NR). These included admissions for surgical procedures unrelated to RA or to study treatment and serious infections. Upper respiratory infections were similar (3.6% vs. 1.8%, p=NR). In the second smaller trial (N=44),18 overall discontinuations were 6.7 percent for IFX plus MTX and methyl-PNL plus MTX and numerically higher (14.3%) for MTX monotherapy (p=NR). Only one person randomized to the IFX plus MTX group experienced a serious adverse event (MTX-related pneumonia at week 30). Other side effects were equally distributed between the groups (benign infection and mild hepatotoxicity).
Single-Arm Study: Corticosteroids Only
One single-arm observational cohort study (N=12,656) examined patients in the Swedish Rheumatology Quality Register with incident RA, matched them to 10 population comparator patients, and followed them over 12 years for lymphoma risk.76 After adjustment for age, sex, and inflammatory activity during the first year of RA diagnosis, corticosteroid use was associated with a reduced risk of lymphoma (RR, 0.5; 95% CI, 0.3 to 0.9).
csDMARDs
csDMARDs Versus csDMARDs
csDMARD Monotherapy Versus csDMARD Monotherapy
One trial27 compared MTX plus prednisolone (PNL) with SSZ plus PNL, and one observational study28 compared MTX with SSZ. In both studies, overall discontinuation rates and discontinuation rates attributable to adverse events were higher for SSZ than for MTX. Overall, the SOE based on either study was insufficient for discontinuations because of adverse events and serious adverse events. Our NWMA supported this finding with higher overall discontinuations for SSZ compared with MTX (RR, 1.83; 95% CI, 1.06 to 3.16) (Figure 20). However, differences in discontinuations due to adverse events were not significant (Figure 21).
In the observational study (N=1,102), the specific adverse events were mixed depending on the drug group.28 The SSZ group experienced significantly higher abdominal pain (8.0% vs. 4.0%, p<0.03) and rash (9.1% vs. 2.7%, p<0.001). The MTX group, however, experienced significantly higher rates of infection (34.1% vs. 20%, p<0.001) and nausea (18.9% vs. 13.1%, p<0.07).
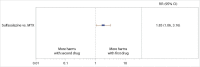
Figure 20
Forest plot for network meta-analysis of all discontinuations: csDMARD monotherapy versus csDMARD monotherapy. 95% CI = 95% confidence interval; csDMARD = conventional synthetic DMARD; MTX = methotrexate; RR = relative risk; vs. = versus.
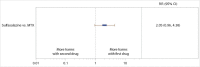
csDMARD Combination Therapy Versus csDMARD Monotherapy
csDMARD combination therapy compared with csDMARD monotherapy did not differ significantly in serious adverse events (low SOE). Six trials compared SSZ plus MTX with csDMARD monotherapy (MTX or SSZ).4, 21–24, 105 Overall discontinuations were mixed. The majority of the trials found no significant differences between SSZ plus MTX groups and csDMARD-only groups. In one 5-year trial (N=155), however, discontinuation rates were higher in the SSZ monotherapy arm than in the MTX plus SSZ (29.1% vs. 8.0%, p=0.0008).24
In addition, one observational study (N=230) found higher rates of overall discontinuation in the MTX plus SSZ group than in the MTX-only group (50.0% vs. 33.9%, p=0.013).26 However, no significant differences occurred in discontinuations due to adverse events (insufficient SOE).
csDMARDs Versus Biologics
TNF Biologic: MTX Plus TNF Biologic Versus Monotherapy With Either MTX or TNF Biologic
Combining a csDMARD with a TNF biologic did not differ significantly in serious adverse events (moderate SOE) or discontinuations attributable to adverse events compared with csDMARD monotherapy (moderate SOE). The PREMIER trial (N=799) examined combination therapy with MTX plus ADA compared with monotherapy with either MTX or ADA in patients with early aggressive RA.15 After 2 years, the MTX plus ADA arm had lower discontinuation rates than either the ADA or MTX monotherapy arm (24.3% vs. 39.1% vs. 34.2%, p<0.001). Neither discontinuations attributable to adverse events (11.9% vs. 9.5% vs. 7.4%, p=0.21) nor the proportion of serious adverse events differed significantly by group (18.5% vs. 21.1% vs. 15.9%, p=0.19). Our NWMA examined ETN plus MTX versus ETN and found no significant differences in all discontinuations (Figure 22) or discontinuations due to adverse events (Figure 23).
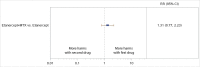
Figure 22
Forest plot for network meta-analysis of all discontinuations: TNF + MTX versus TNF. 95% CI = 95% confidence interval; MTX = methotrexate; RR = relative risk; TNF = tumor necrosis factor; vs. = versus.
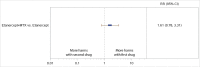
Figure 23
Forest plot for network meta-analysis of discontinuations due to adverse events: TNF + MTX versus TNF. 95% CI = 95% confidence interval; MTX = methotrexate; RR = relative risk; TNF = tumor necrosis factor; vs. = versus.
Non-TNF Biologic: MTX Plus Non-TNF Biologic Versus Monotherapy With Either MTX or Non-TNF Biologic
One trial compared the combination of ABA plus MTX with either ABA or MTX monotherapy: the AVERT study (N=351).7 It found no significant differences in overall discontinuation rates, discontinuation attributable to adverse events, or serious adverse events.
Two RCTs examined discontinuation rates for patients receiving combination therapy with TCZ plus MTX and patients receiving either MTX or TCZ monotherapy: the FUNCTION 2-year trial (N=1,162)32, 134 and the U-Act-Early 2-year trial (N=317).33 Overall discontinuation rates and discontinuation attributable to either adverse events (U-Act-Early: 8.5% vs. 9.7% vs. 7.4%, p=0.82) or serious adverse events (U-Act-Early: 16.0% vs. 18.4% vs. 12.0%, p=0.44) did not differ across these groups (moderate SOE).
The NWMA similarly found no significant differences in overall discontinuations or discontinuations attributable to adverse events for TCZ monotherapy compared with TCZ plus MTX. Figure 24 presents findings for all discontinuations and Figure 25 for discontinuations attributable to adverse events; in both cases, results are reported as RRs with 95% CIs. NWMA also examined ABA plus MTX and found no significant differences in overall discontinuations but fewer discontinuations due to adverse events for ABA plus MTX than ABA monotherapy (RR, 0.34; 95% CI, 0.18 to 0.64).
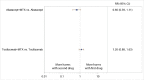
Figure 24
Forest plot for network meta-analysis of all discontinuations: Non-TNF + MTX versus non-TNF. 95% CI = 95% confidence interval; MTX = methotrexate; RR = relative risk; TNF = tumor necrosis factor; vs. = versus.
Figure 25
Forest plot for network meta-analysis of discontinuations due to adverse events: Non-TNF + MTX versus non-TNF. 95% CI = 95% confidence interval; MTX = methotrexate; RR = relative risk; TNF = tumor necrosis factor; vs. = versus.
csDMARDs versus tsDMARDs: MTX Plus tsDMARD Versus Either MTX or tsDMARD
One RCT (N=109) compared the combination of TOF plus MTX with monotherapy (TOF or MTX) over 12 months in patients with early active RA.29 Overall discontinuation rates were 21.4 percent for the combination therapy group, 43.2 percent for TOF monotherapy, and 25.0 percent for MTX monotherapy. The groups did not have any significant differences for discontinuations attributable to adverse events (TOF monotherapy, 5.6%; MTX monotherapy, 13.5%; TOF plus MTX therapy, 11.1%). Additionally, no differences in serious adverse events were reported for patients receiving TOF monotherapy (2.8%), MTX monotherapy (5.4%), or TOF plus MTX therapy (5.6%) (insufficient SOE).
Single-Arm Studies: csDMARDs Only
Four single-arm observational studies examined various approaches to using csDMARDs. One involved a three-csDMARD regimen (MTX plus SSZ plus either HCQ or LEF);5 another study focused only on LEF,108 a third on MTX exposure or TNFi (i.e., TNF biologic exposure),76 and a fourth only on MTX.77 SSZ was the most common drug removed from triple therapy because of adverse events (49.0%) over 70 weeks,5 followed by MTX (29.0%) and HCQ (13.0%). A 15-year retrospective observational study examined exposure to RA drugs in the first year (csDMARDs, corticosteroids, biologics) and subsequent lymphoma diagnosis and found no increased lymphoma risk in patients exposed to MTX (RR, 0.9; 95% CI, 0.8 to 1.0) in the first year of diagnosis compared with RA patients.76 In a 1-year prospective study of LEF, overall discontinuation was 11.1 percent.19 In a cohort of patients with early RA taking MTX, 50 percent discontinued after 10.9 years (reasons for discontinuation not described).77
Biologics
TNF Biologics
TNF Biologic Versus csDMARD Monotherapy
Neither serious adverse events nor discontinuations attributable to adverse events differed significantly between the TNF biologics (ADA, CZP, ETN, IFX) in combination with MTX versus MTX monotherapy (low SOE). In NWMA, TNF biologics (ADA, CZP, ETN, IFX) plus MTX had lower overall discontinuations than the csDMARD SSZ (range of RR, 0.35 to 0.48 [95% CI, 0.18 to 0.89]); only IFX plus MTX had higher discontinuation resulting from adverse events (RR, 3.03; 95% CI, 1.56 to 5.90) (Figure 26 and Figure 27, respectively).
Adalimumab. Five RCTs examined the combination of ADA plus MTX with MTX monotherapy over 26 weeks to 2 years.13, 15, 34, 35, 37, 103, 114–119, 150–152 In general, no significant differences were observed for discontinuations due to adverse events or serious adverse events (low SOE). In NWMA, there were no differences in overall discontinuations or discontinuations due to adverse events (Figure 26 and Figure 27, respectively).
![Figure 26 displays a forest plot for the network meta-analysis reporting all discontinuations in studies comparing TNF biologics plus MTX with csDMARDs. Eight comparisons were used in this analysis. Study-level data used in this Figure are presented in Appendix C. This figure is described further in the KQ3 Results section “TNF Biologic Versus csDMARD Monotherapy” as follows: “In NWMA, TNF biologics (ADA, CZP, ETN, IFX) plus MTX had lower overall discontinuations than the csDMARD SSZ (range of RR, 0.35 to 0.48 [95% CI, 0.18 to 0.89])”.](/books/NBK524949/bin/ch4f25.gif)
Figure 26
Forest plot for network meta-analysis of all discontinuations: TNF + MTX versus csDMARD. 95% CI = 95% confidence interval; MTX = methotrexate; RR = relative risk; TNF = tumor necrosis factor; vs. = versus.
Figure 27
Forest plot for network meta-analysis of discontinuations due to adverse events: TNF + MTX versus csDMARD. 95% CI = 95% confidence interval; MTX = methotrexate; RR = relative risk; TNF = tumor necrosis factor; vs. = versus.
Certolizumab pegol. The C-OPERA trial (N=316) examined the combination of CZP plus MTX.13, 153 At 2 years, the overall discontinuation rate for CZP plus MTX was 53.5 percent vs. 63.7 percent for MTX monotherapy (p=NR). Discontinuations attributable to adverse events and serious adverse events did not differ significantly between groups (low SOE). Similarly, the C-EARLY trial (N=879)38, 39 observed a lower discontinuation rate for CZP plus MTX over 1 year (24.2% vs. 34.7%, p=NR) but no differences in discontinuations due to adverse events or differences in serious adverse events between groups. In NWMA, there was lower overall discontinuation for CZP plus MTX versus MTX monotherapy (RR, 0.64; 95% CI, 0.52 to 0.78) but no significant differences in discontinuations due to adverse events (Figure 26 and Figure 27, respectively).
Etanercept. Three trials compared ETN with MTX; one (N=542) compared combination therapy ETN plus MTX with MTX monotherapy;12, 108, 109, 154–156 the two others (N=632 and N=26) compared ETN with MTX monotherapy.14, 110–113 In the two larger trials, overall discontinuation rates were higher for the MTX-only group (12.7% vs. 10.2%12 and 40.5% vs. 25.6%14); no significant differences in serious adverse events and discontinuations attributable to serious adverse events were observed in all three trials (low SOE). In NWMA, ETN plus MTX had a lower overall discontinuation rate than MTX monotherapy (RR, 0.66; 95% CI, 0.47 to 0.92) but no significant differences in discontinuation due to adverse events (Figure 26 and Figure 27, respectively).
Infliximab. Two trials assessed adverse events from combinations of IFX (3 mg/kg/8 weeks or 6 mg/kg/8 weeks) plus MTX compared with MTX monotherapy.17, 18 The ASPIRE trial (N=1,049) found no significant differences in overall discontinuation rates (21.4% vs. 24.8% vs. 25.5%, p=NR), discontinuations attributable to adverse effects (9.5% vs. 9.6% vs. 3.2%, p=NR), and serious adverse events (11.0% vs. 14.0% vs. 14.0%, p=NR) (low SOE). Rates of serious infections, however, were higher in the IFX plus MTX groups than in the MTX monotherapy group (5.6%, 5.0%, 2.1%, p=0.02). Another smaller trial18 described lower overall discontinuation rates for IFX plus MTX than MTX monotherapy (6.7% vs. 14.3%, p=NR), one serious adverse event in the IFX plus MTX group (MTX related pneumonia), and similar side effects (benign infections, mild hepatotoxicity), but the sample was much smaller (N=44). In NWMA, there were no significant differences in overall discontinuation for IFX plus MTX, but there were higher discontinuations due to adverse events than MTX (RR, 3.03; 95% CI, 1.56 to 5.90) (Figure 26 and Figure 27, respectively).
TNF Biologic Versus csDMARD Combination Therapy
Adalimumab. The IMPROVED trial was a 2-year multicenter randomized single-blind trial (N=161) comparing ADA plus MTX with a combination of MTX, HCQ, and SSZ plus PRED in MTX nonresponders.9, 120, 158 Serious adverse events did not differ significantly (insufficient SOE). However, patients in the ADA plus MTX group experienced elevated liver enzymes at 4 percent and patients in the four-drug combination group at 8 percent (p=NR).
Infliximab. The SWEFOT trial was a multicenter randomized trial comparing MTX plus SSZ plus HCQ with IFX plus MTX over 1 year in MTX non responders.10, 121–126 The IFX plus MTX group reported lower overall discontinuation than the csDMARD combination group (18.0% vs. 31.5%, p=0.014). Rates of serious adverse events (0.8% vs. 0.8%, p=NR) and discontinuation attributable to adverse events (7.8% vs. 10.8%, p=NR) were similar.
The NEO-RACo trial also found no significant differences in either discontinuation attributable to adverse events (2.0% vs. 0.0%, p=NR) or serious adverse events (6.0% vs. 8.0%, p=NR).40 Overall, the SOE was low for discontinuations due to adverse events and serious adverse events.
Single-Arm Studies: TNF Biologics only
A single-arm observational cohort study (N=12,656) in the Swedish Rheumatology Quality Register examined patients with incident RA and subsequent diagnosis of lymphoma.76 After adjustment for age, sex, and inflammatory activity during the first year of RA diagnosis, there was no increased lymphoma risk in patients who took a TNF inhibitor compared with those who did not take a TNF inhibitor (RR, 0.9; 95% CI, 0.9 to 1.9).
Non-TNF Biologics
Non-TNF Biologic Plus MTX Versus Either Non-TNF Biologic or MTX
Serious adverse events or discontinuations attributable to adverse events did not differ significantly between the non-TNF biologics in combination with MTX versus MTX monotherapy (low SOE for ABA, moderate SOE for RIT).
Abatacept. Two trials compared the combination of ABA plus MTX with MTX only: the AGREE trial (N=509)31, 129–131 and the AVERT study (N=351).7 Both trials found no significant differences in overall discontinuation rates, discontinuation attributable to adverse events, or serious adverse events. In NWMA, the csDMARD ABA plus MTX had fewer overall discontinuations than SSZ (RR 0.47; 95% CI, 0.24 to 0.92) and discontinuations due to adverse events (RR, 0.24; 95% CI, 0.09 to 0.61) (Figure 28 and Figure 29, respectively). There was no difference in overall discontinuation between ABA plus MTX and MTX alone, though ABA plus MTX had less discontinuation due to adverse events (RR, 0.49, 95% CI, 0.28 to 0.86).

Figure 28
Forest plot for network meta-analysis of all discontinuations: Non-TNF + MTX versus csDMARD. 95% CI = 95% confidence interval; MTX = methotrexate; RR = relative risk; TNF = tumor necrosis factor; vs. = versus.
Figure 29
Forest plot for network meta-analysis of discontinuations due to adverse events: Non-TNF + MTX versus csDMARD. 95% CI = 95% confidence interval; MTX = methotrexate; RR = relative risk; TNF = tumor necrosis factor; vs. = versus.
Rituximab. The 2-year IMAGE trial (N=755) randomized patients to RIT (1 g days 1 and 15) plus MTX (7.5 mg-20 mg/week) combination therapy, RIT (500 mg days 1 and 15) plus MTX (7.5 mg-20 mg/week) combination therapy, or MTX monotherapy.30, 132, 133 Overall discontinuation rates were 29 percent in the MTX monotherapy group compared with 15 percent in both RIT plus MTX combination therapy groups (p=NR). Discontinuation attributable to adverse events and serious adverse events did not differ across the groups.
Tocilizumab. Two RCTs, previously described in the csDMARDs versus non-TNF biologics section, examined discontinuation rates for patients receiving combination therapy with TCZ plus MTX and patients receiving either TCZ or MTX monotherapy: the FUNCTION 2-year trial (N=1,162)32, 134 and the U-Act-Early 2-year trial (N=317).33 Overall discontinuation rates and discontinuation attributable to either adverse events (U-Act-Early: 8.5% vs. 9.7% vs. 7.4%, p=0.82) or serious adverse events (U-Act-Early: 16.0% vs. 18.4% vs. 12.0%, p=0.44) did not differ across these groups (moderate SOE).
Biologic Head to Head: TNF Versus Non-TNF
The ORBIT trial (N=329), an open-label noninferiority RCT, compared the non-TNF biologic RIT with the TNF, ADA or ETN, over 1 year rated high risk of bias.8 Overall discontinuations (18.8% vs. 17.7%, p=NR) and discontinuations attributable to adverse events (1.4% vs. 1.3%, p=NR) did not differ between the two groups. The RIT group, however, had higher rates of serious adverse events than the comparison group, primarily related to infections and neutropenia (25.7% vs. 17.2%, p=NR). The harms evidence was insufficient for head-to-head comparisons of TNF and non-TNF biologics.
In our NWMA of TNF versus non-TNF, ETN led to fewer overall discontinuations than ABA (RR, 0.38; 95% CI, 0.20 to 0.74) and discontinuations due to adverse events (RR, 0.35; 95% CI, 0.17 to 0.71) (Figure 30 and Figure 31, respectively). There were also higher rates of discontinuations due to adverse events with CZP plus MTX (RR, 2.21; 95% CI, 1.07 to 4.57) or IFX plus MTX (RR, 6.18; 95% CI, 2.59 to 14.72) than ABA plus MTX. ETN alone also had fewer overall discontinuations than TCZ (RR, 0.59; 95% CI, 0.35 to 0.98) and discontinuations due to adverse events (RR, 0.30; 95% CI, 0.14 to 0.63). There was less overall discontinuation for CZP plus MTX than TCZ plus MTX (RR 0.63, 95% CI, 0.44 to 0.90) and less discontinuation due to adverse events for ETN plus MTX than TCZ plus MTX (RR, 0.39; 95% CI, 0.20 to 0.74).
Figure 30
Forest plot for network meta-analysis of all discontinuations: TNF versus non-TNF. 95% CI = 95% confidence interval; MTX = methotrexate; RR = relative risk; TNF = tumor necrosis factor; vs. = versus.
Figure 31
Forest plot for network meta-analysis of discontinuations due to adverse events: TNF versus non-TNF. 95% CI = 95% confidence interval; MTX = methotrexate; RR = relative risk; TNF = tumor necrosis factor; vs. = versus.
TNF Versus TNF
No direct evidence was available for TNF versus TNF. The SOE for all indirect estimates was low (downgrading for indirectness and imprecision in all cases). In NWMA, there were no differences detected in overall discontinuations. IFX plus MTX led to higher rates of overall discontinuations due to adverse events than both CZP plus MTX (RR, 2.80; 95% CI, 1.24 to 6.31) and ETN plus MTX (RR, 3.76; 95% CI, 1.66 to 8.51) (Figure 32 and Figure 33, respectively). Other comparisons shown below did not have significant differences.
Figure 32
Forest plot for network meta-analysis of all discontinuations: TNF versus TNF. 95% CI = 95% confidence interval; MTX = methotrexate; RR = relative risk; TNF = tumor necrosis factor; vs. = versus.
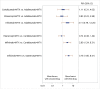
Figure 33
Forest plot for network meta-analysis of discontinuations due to adverse events: TNF versus TNF. 95% CI = 95% confidence interval; MTX = methotrexate; RR = relative risk; TNF = tumor necrosis factor; vs. = versus.
Non-TNF Versus Non-TNF
No direct evidence was available for non-TNF versus non-TNF. The SOE for all indirect estimates was low (downgrading for indirectness and imprecision in all cases). In NWMA, there were no differences detected in overall discontinuations between TCZ and ABA or TCZ and ABA with MTX (Figure 34 and Figure 35, respectively). Discontinuations due to adverse events were only higher for TCZ plus MTX than ABA plus MTX (RR, 4.25; 95% CI, 2.07 to 8.72) (Figure 35).
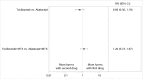
Figure 34
Forest plot for network meta-analysis of all discontinuations: Non-TNF versus non-TNF. 95% CI = 95% confidence interval; MTX = methotrexate; RR = relative risk; TNF = tumor necrosis factor; vs. = versus.
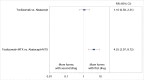
Figure 35
Forest plot for network meta-analysis of discontinuations due to adverse events: Non-TNF versus non-TNF. 95% CI = 95% confidence interval; MTX = methotrexate; RR = relative risk; TNF = tumor necrosis factor; vs. = versus.
Combinations and Therapy Strategies
Long-term studies of combination strategies using multiple csDMARDs or csDMARD plus TNF biologics ultimately showed no differences in serious adverse events between immediate combination and step-up therapies (low SOE). The BeSt trial (N=508) examined four groups: (1) sequential DMARD, starting with MTX; (2) stepped-up combination therapy with MTX followed by SSZ, HCQ, and prednisone; (3) initial combination therapy of MTX, SSZ, and tapered high-dose PRED; and (4) initial combination therapy with MTX and IFX.79–91 In general, discontinuation rates trended highest in group 2 (step-up combination therapy) after 5 years (12%, 22%, 15%, 9%, p=0.05). Serious adverse events did not differ significantly across the groups. At 10 years, there were also no significant adverse events across groups (events per 100 patient/years: 13.2, 10.9, 12.1, 13.4, p=0.47).
The GUEPARD study92 randomized MTX-naïve patients to 3 months of ADA plus MTX or MTX monotherapy. In patients who at 3 months did not respond to an initial strategy, investigators examined whether disease activity–driven treatment with TNF inhibitors was equally effective in controlling clinical symptoms and structural damage in both groups. Overall discontinuations trended higher for the ADA plus MTX initial strategy (15.2% vs. 9.4%, p=NR), but there were no significant differences in serious adverse events between groups. We rated this study high ROB after 12 weeks because of the risk of contamination bias given that patients could be switched to difference dosing and treatment regimens when low disease activity was achieved at 12 weeks and beyond.
The two year OPERA study36, 160–163 of 180 early RA patients in Danish hospital-based clinics using a treat to target protocol found numerically lower overall discontinuations (10.1% vs 16.5%, p=NR) and lower serious adverse events (n= 4 vs. n=11, p=NR) in the ADA plus MTX strategy than the MTX plus placebo group.
The TEAR trial (N=755) randomized patients to four treatment arms:20, 159 (1) immediate treatment with MTX plus ETN; (2) immediate treatment with MTX plus SSZ plus HCQ (triple therapy); (3) step-up from MTX to MTX plus ETN if DAS28-ESR was 3.2 or higher; and (4) step-up from MTX to triple therapy if DAS28-ESR was 3.2 or higher. We rated this trial as high ROB because overall discontinuation rates were high (up to 42%); the therapy groups did not differ, however, on this measure. In addition, adverse events did not differ significantly across the groups.
KQ 4. Comparative Benefits and Harms in Subgroups of Patients
For KQ 4, we were interested in differences in benefits and harms among subpopulations based on age, sex or gender, race or ethnicity, disease activity, prior therapies, concomitant therapies, and other serious medical conditions. For most of our eligible interventions and for most subgroups of interest, we did not find any comparative evidence. The available evidence was limited to post hoc subgroup analyses of some TNF biologics versus csDMARDs.
Key Points
- For most comparisons of interest, we did not find any eligible evidence on differences in benefits and harms among subpopulations.
- The available evidence is limited to post hoc analyses without statistical subgroup analyses. It provides no reliable information on differences among subpopulations.
- Evidence was insufficient to draw any conclusions about response rates between older and younger patients or about response rate and radiographic changes between people with different levels of disease activity who were taking MTX with or without a TNF biologic (ADA or IFX).
- Evidence was insufficient to draw any conclusions about serious adverse events as defined by FDA between older and younger patients who were taking MTX or the TNF biologic ETN.
Detailed Synthesis
Corticosteroids
We found no eligible evidence on subgroups of interest.
csDMARDs
We found no eligible evidence on subgroups of interest.
TNF Biologic Versus csDMARD Monotherapy
Post hoc analyses of data from three RCTs provided information on some subgroups of interest. These analyses were limited to ADA plus MTX,35 ETN monotherapy,111 and IFX plus MTX106 compared with MTX monotherapy. Because of the post hoc nature of these analyses, results should be interpreted cautiously. None of these studies conducted subgroup analyses using tests of interaction.
Adalimumab. A post hoc subgroup analysis of the HOPEFUL 1 trial assessed the impact of patients’ disease activity on radiographic progression and remission.35 In multivariate regression analyses, low disease activity at baseline was statistically significantly associated with no radiographic progression (p=0.01) and with remission (p=0.02) in patients treated with MTX but not in those on ADA and MTX combination treatment (insufficient SOE). The analyses did not compare the two subgroups directly.
Etanercept. A descriptive, retrospective analysis of the ERA trial presented data on efficacy and serious adverse events in patients 65 years or older and those younger than 65 years of age.111 The investigators did not conduct any statistical subgroup analyses. After 24 months of ETN treatment, patients 65 years or older had lower ACR response rates than younger patients (ACR50, 22% vs. 54%; ACR70, 14% vs. 32%) (insufficient SOE). Likewise, older patients in the MTX group had lower ACR response rates than younger patients (ACR50, 31% vs. 43%; ACR70, 13% vs. 25%) (insufficient SOE). Older patients had substantially higher risks of serious adverse events than younger patients in the ETN group (32.1 events vs. 4.6 events per 100 patient-years) and in the MTX group (41.7 events vs. 7.2 events per 100 patient-years) (insufficient SOE). The specific serious adverse events were not described in the study.
Infliximab. A post hoc analyses of the ASPIRE trial found that progression of joint damage was related to patients’ disease activity in both the IFX plus MTX and the MTX monotherapy groups.106 Patients with low, moderate, and high disease activity, however, experienced less joint damage in the IFX plus MTX group than in the MTX monotherapy group (p=0.01) (insufficient SOE).
Combinations and Therapy Strategies
In post hoc subgroup analyses of the SWEFOT study, investigators determined the impact of obesity on treatment effects.168 The SWEFOT study compared triple therapy of synthetic DMARDs (MTX + SSZ + HZQ) with a combination therapy of IFX plus MTX. Post hoc subgroup analyses stratified patients into those with a body mass index (BMI) greater than 30, a BMI between 25 and 29.9, and those with normal weight and a BMI of less than 25. Among all patients, normal-weight patients achieved higher rates of EULAR good-response at 24 months than obese patients (66% vs. 38%; OR, 3.2; 95% CI, 1.4 to 7.3). Likewise, normal-weight patients had higher rates of remission (52% vs. 15%; OR, 6.0; 95 CI%, 1.6 to 22.6) than obese patients. The study did not determine the effect of obesity on the comparative benefits and harms of these treatment regimens.
- Organization of the Results
- Search Results
- Comparative Benefits of Drug Therapies for Patients With Early RA in Relation to Disease Activity, Progression of Radiographic Joint Damage, or Remission
- Comparative Benefits of Drug Therapies for Patients With Early RA in Relation to Patient-Reported Symptoms, Functional Capacity, or Quality of Life
- Comparative Harms of Drug Therapies for Patients With Early RA in Relation to Harms, Tolerability, Patient Adherence, or Adverse Effects
- Comparative Benefits and Harms in Subgroups of Patients
- Results - Drug Therapy for Early Rheumatoid Arthritis: A Systematic Review Updat...Results - Drug Therapy for Early Rheumatoid Arthritis: A Systematic Review Update
Your browsing activity is empty.
Activity recording is turned off.
See more...