U.S. flag

An official website of the United States government

NCBI Bookshelf. A service of the National Library of Medicine, National Institutes of Health.

Donahue KE, Gartlehner G, Schulman ER, et al. Drug Therapy for Early Rheumatoid Arthritis: A Systematic Review Update [Internet]. Rockville (MD): Agency for Healthcare Research and Quality (US); 2018 Jul. (Comparative Effectiveness Review, No. 211.)
Cover of Drug Therapy for Early Rheumatoid Arthritis: A Systematic Review Update

Drug Therapy for Early Rheumatoid Arthritis: A Systematic Review Update [Internet].

Show details

Appendix HSupplementary Primary Network Meta-Analyses

Overview of Content

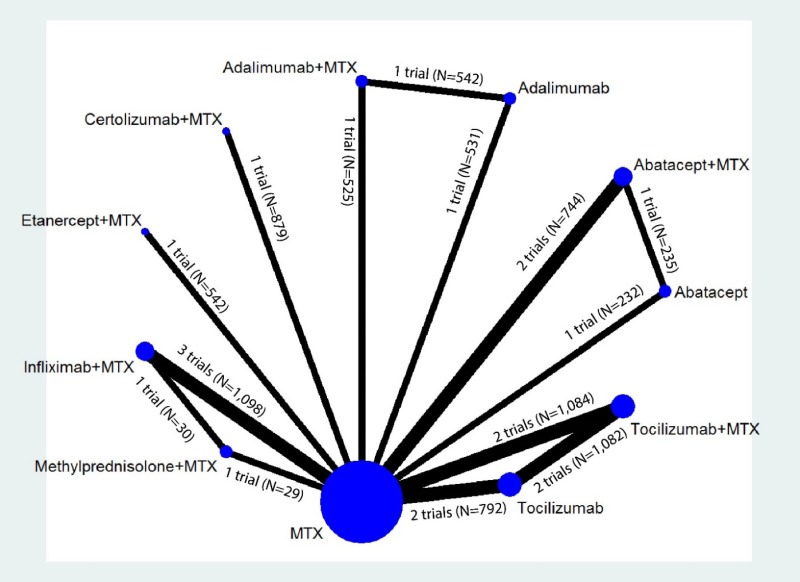
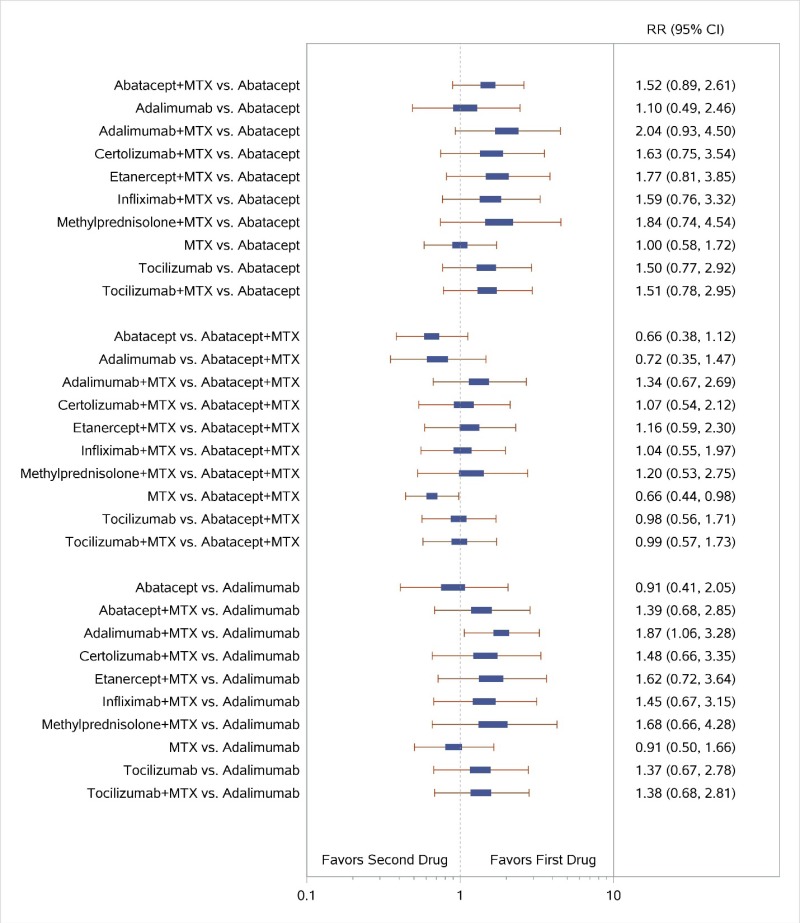
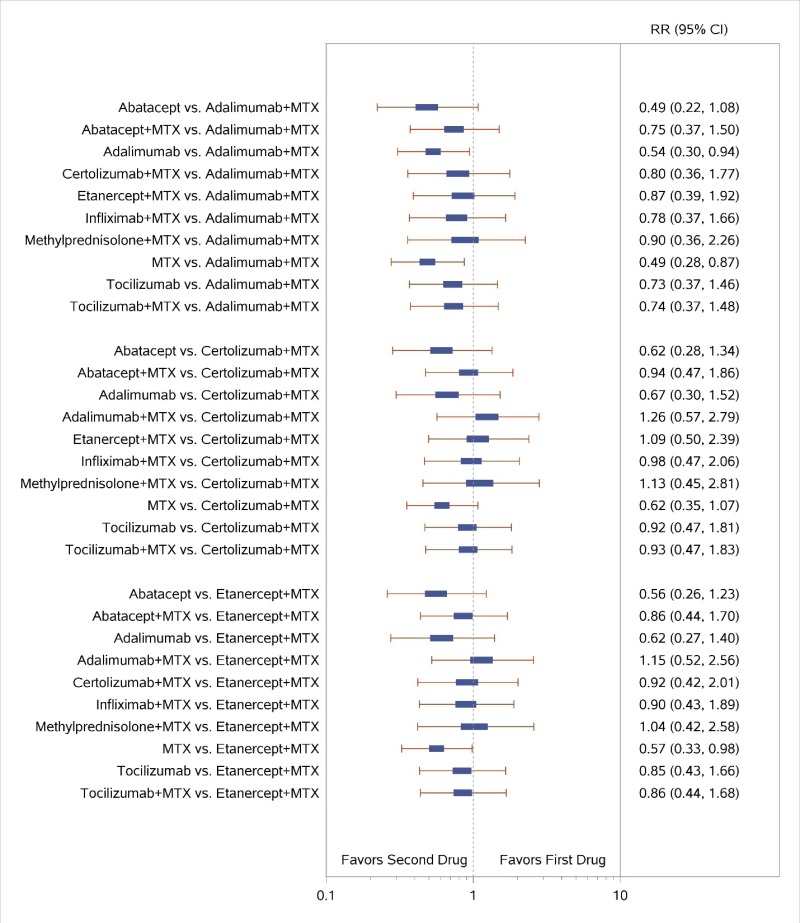
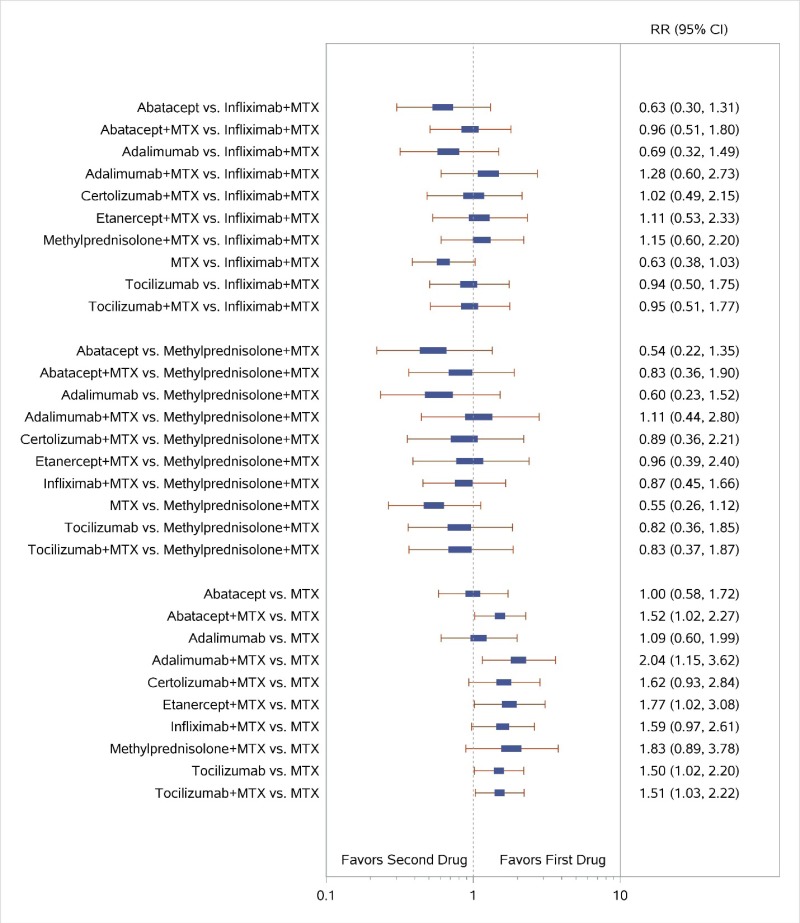
This appendix contains the results of primary network meta-analyses (NWMA) based on studies with low or medium risk of bias but not shown in our main report because they rendered mostly inconclusive findings with wide confidence intervals. Specifically, these analyses evaluated Disease Activity Score (DAS) remission (Appendix Figure H-2). The network diagram for this outcome are presented in Appendix Figure H-1.

Additionally, we present full forest plots presenting our NWMA across all comparisons (and not within each comparison section) for every outcome of interest discussed in the main report: American College of Rheumatology response defined by 50 percent improvement (ACR50), radiographic joint damage, overall discontinuation, and discontinuation due to adverse events. These appear in Appendix Figure H-4, Appendix Figure H-6, Appendix Figure H-8, and Appendix Figure H-9, respectively, and network diagrams for these outcomes appear in Appendix Figure H-3, Appendix Figure H-5, and Appendix Figure H-7 (for both discontinuation outcomes), respectively.

Appendix Table H-1 lists the specific studies with low or medium risk of bias and reporting on outcomes of interest for our NWMA. These outcomes include DAS remission (n=10), ACR50 (n=11), radiographic joint damage (n=10), overall discontinuation (n=10), and discontinuation due to adverse events (n=12).

Appendix Table H-1Studies included in any KQ1 or KQ3 primary network meta-analyses

Treatment ComparisonStudy NameDAS RemissionaOverall D/CaD/C due to AEsaACR50aRadiographic joint damagea
ABA+MTX vs. MTXAGREE, 2009,31 2011,129, 130 2015131XXXXX
ABA+MTX vs. ABA vs. MTXAVERT, 20157XXXX
ADA+MTX vs. ADA vs. MTXPREMIER, 2006,15 2008,103 2010,115 2012,116 2013,117 2014,118 2015119XXX
CZP+MTX vs. MTXC-EARLY, 201738, 39XXXXX
ETN vs. MTXEnbrel ERA, 2000,14 2002,110 2005,164 2006111XXXX
ETN+MTX vs. MTXCOMET, 2008,12 2009,154 2010,108, 109 2012;155 2014,156XXXXX
IFX+MTX vs. MTXASPIRE, 2004,17 2006,107 2009,106 2017157XXXXX
IFX+MTX vs. Methyl-PNL+MTX vs. MTXDurez et al., 200718XXXXX
IFX+MTX vs. MTXQuinn et al., 200541XXX
SSZ+MTX vs. SSZ vs. MTXDougados et al., 1999;21 Maillefert et al., 2003104XXX
SSZ+MTX vs. SSZ vs. MTXHaagsma et al., 199723XX
TCZ+MTX vs. TCZ vs. MTXFUNCTION, 2016,32 2017134XXXXX
TCZ+MTX vs. TCZ vs. MTXU-Act-Early, 201633XXXXX

ABA = abatacept; ACR50 = American College of Rheumatology 50% improvement; ADA = adalimumab; AE = adverse event; AGREE = Abatacept trial to Gauge Remission and joint damage progression in methotrexate-naïve patients with Early Erosive rheumatoid arthritis; ASPIRE = Active-controlled Study of Patients receiving Infliximab for the treatment of Rheumatoid arthritis of Early onset trial; AVERT = Assessing Very Early Rheumatoid arthritis Treatment trial; C-EARLY = trial whose acronym not described; C-OPERA = Certolizumab-Optimal Prevention of joint damage for Early RA trial; COMET = Combination of Methotrexate and Etanercept in Active Early Rheumatoid Arthritis trial; CZP = certolizumab pegol; D/C = discontinuation; DAS = Disease Activity Score; Enbrel ERA = Enbrel Early RA trial; ETN = etanercept; FUNCTION = trial whose acronym not described; IFX = infliximab; Methyl-PNL = methylprednisolone; MTX = methotrexate; NA = not applicable; NWMA = network meta-analysis; PREMIER = trial whose acronym not described; RA = rheumatoid arthritis; ROB = risk of bias; SSZ = sulfasalazine; TCZ = tocilizumab; U-Act-Early = Trial whose acronym not described; vs. = versus

a

All data used in NWMA were measured at the 1-year follow-up timepoint.

Network Diagrams and Forest Plots

Figure H-1 displays the evidence network for the network meta-analysis for remission according to Disease Activity Score. The diagram graphically displays the number of studies that comprise the evidence base for the analysis and indicates the number of head-to-head and MTX-controlled studies underpinning the pairwise comparisons. The number of trials and participants for each comparison with MTX are as follows: Abatacept (1 trial, N=232), Abatacept plus MTX (2 trials, N=744), Adalimumab (1 trial, N=531), Adalimumab plus MTX (1 trial, N=525), Certolizumab plus MTX (1 trial, N=879), Etanercept plus MTX (1 trial, N=542), Infliximab plus MTX (3 trials, N=1,098), Methylprednisolone plus MTX (1 trial, N=29), Tocilizumab (2 trials, N=792), and Tocilizumab plus MTX (2 trials, N=1,084). The number of trials and participants for the head-to-head comparisons are as follows: Abatacept vs. Abatacept plus MTX (1 trial, N=235), Adalimumab vs. Adalimumab plus MTX (1 trial, N=542), Infliximab plus MTX vs. Methylprednisolone plus MTX (1 trial, N=30), and Tocilizumab vs. Tocilizumab plus MTX (2 trials, N=1,082).

Appendix Figure H-1Network diagram for network meta-analysis: Remission according to Disease Activity Score

MTX = methotrexate; N = number of patients

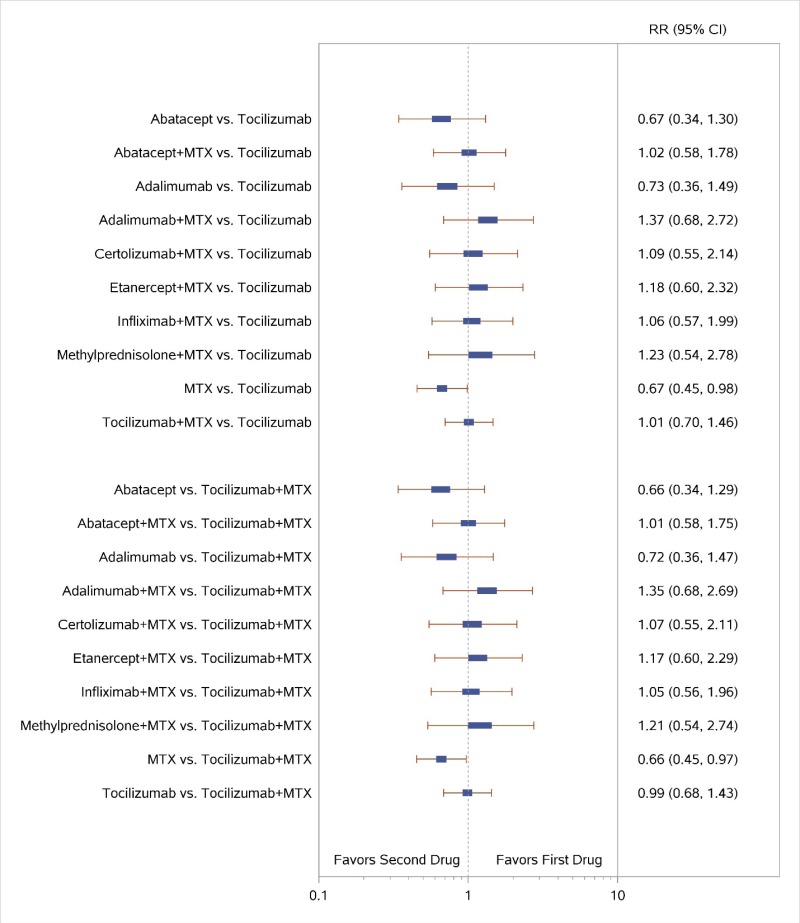
Figure H-2 displays a forest plot for the network meta-analysis of studies reporting data for remission according to Disease Activity Score. Study-level data used in this Figure are presented in Appendix C. The results of this figure’s analyses are summarized in the KQ 1 Results section as follows: “For remission, NWMA rendered mostly inconclusive findings with wide confidence intervals”.

Appendix Figure H-2Forest plots for network meta-analysis: Remission according to Disease Activity Score

MTX = methotrexate; RR = relative risk; vs. = versus; 95% CI = 95% confidence interval

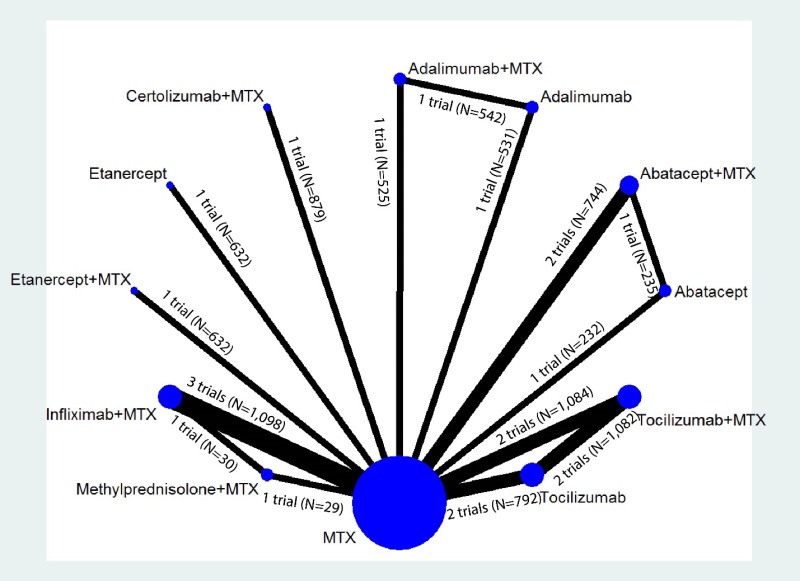
Figure H-3 displays the evidence network for the ACR50 network meta-analysis. The diagram graphically displays the number of studies that comprise the evidence base for the analysis and indicates the number of head-to-head and MTX-controlled studies underpinning the pairwise comparisons. The number of trials and participants for each comparison with MTX are as follows: Abatacept (1 trial, N=232), Abatacept plus MTX (2 trials, N=744), Adalimumab (1 trial, N=531), Adalimumab plus MTX (1 trial, N=525), Certolizumab plus MTX (1 trial, N=879), Etanercept (1 trial, N=632), Etanercept plus MTX (1 trial, N=632), Infliximab plus MTX (3 trials, N=1,098), Methylprednisolone plus MTX (1 trial, N=29), Tocilizumab (2 trials, N=792), and Tocilizumab plus MTX (2 trials, N=1,084). The number of trials and participants for the head-to-head comparisons are as follows: Abatacept vs. Abatacept plus MTX (1 trial, N=235), Adalimumab vs. Adalimumab plus MTX (1 trial, N=542), Infliximab plus MTX vs. Methylprednisolone plus MTX (1 trial, N=30), and Tocilizumab vs. Tocilizumab plus MTX (2 trials, N=1,082).

Appendix Figure H-3Network diagram for network meta-analysis: ACR50 response

ACR50 = American College of Rheumatology 50% improvement; MTX = methotrexate; N = number of patients

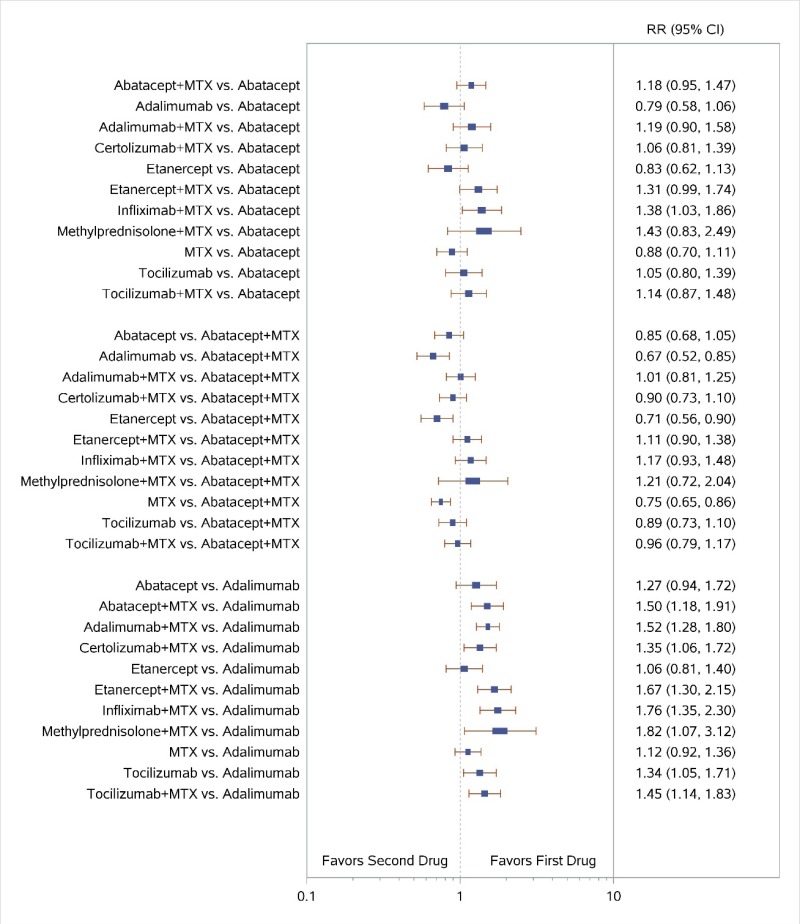
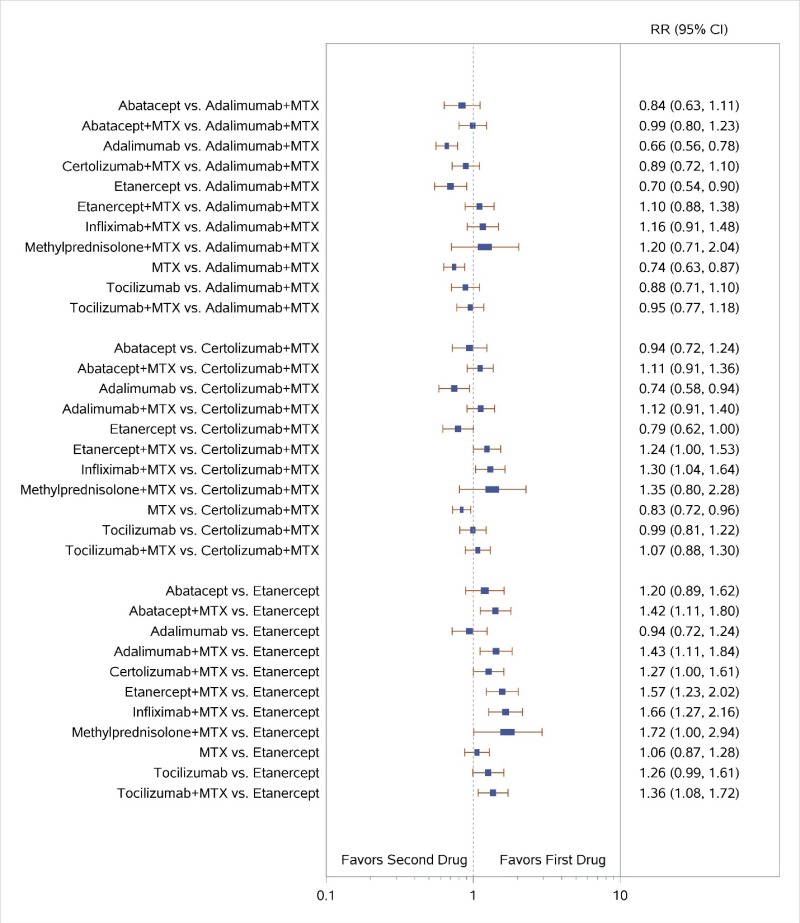
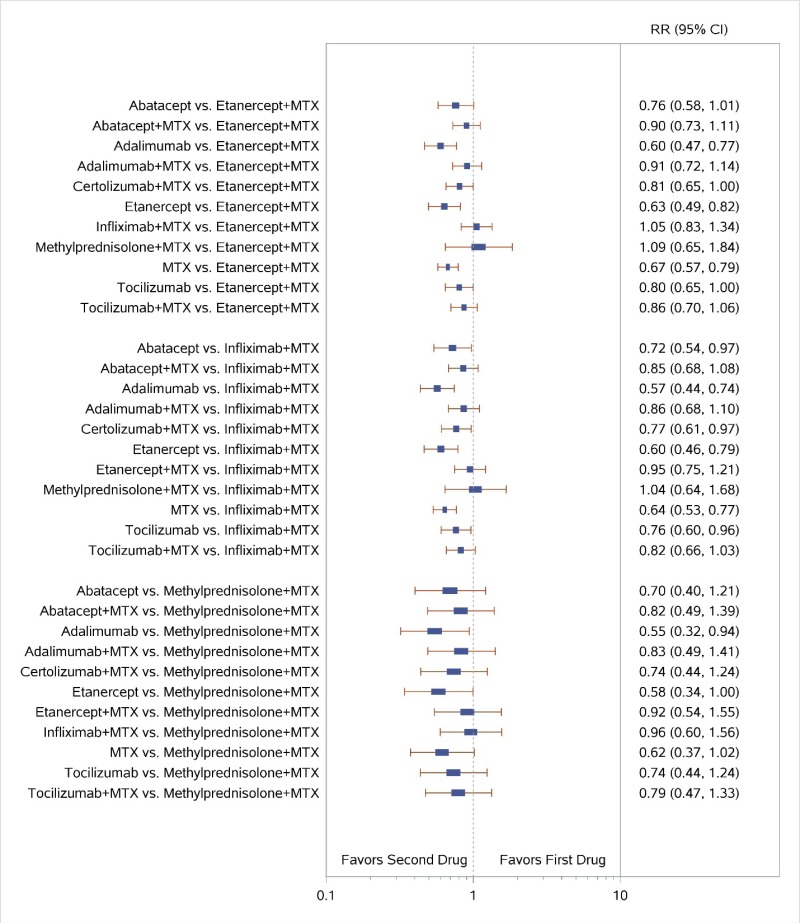
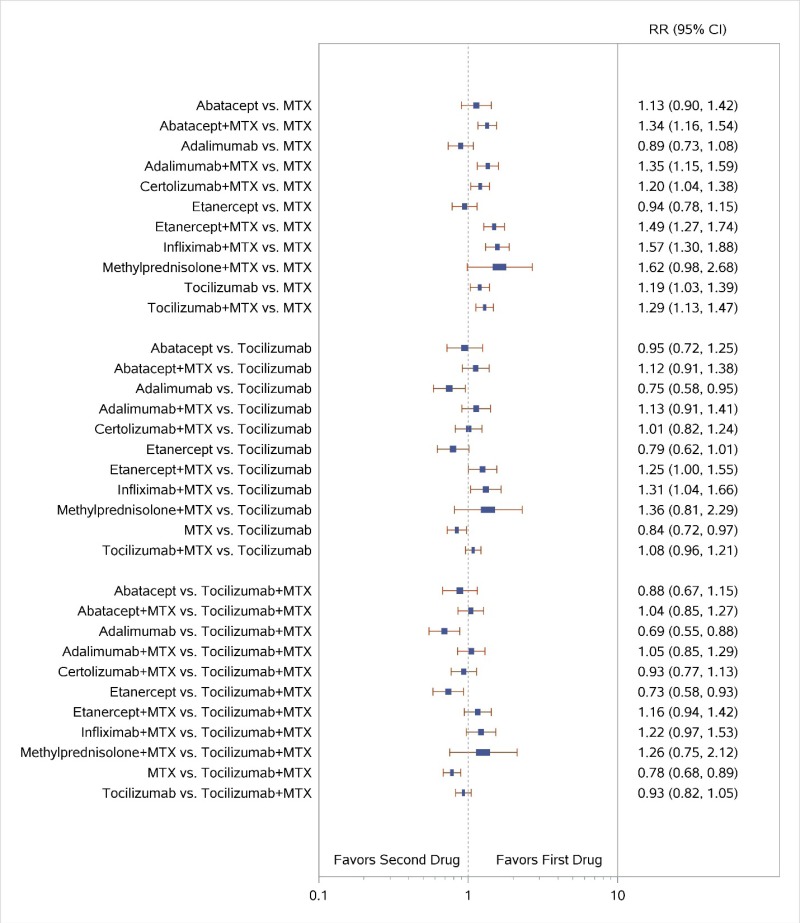
Figure H-4 displays a forest plot for the network meta-analysis of studies reporting data for ACR50 response. Study-level data used in this Figure are presented in Appendix C. The results of this figure’s analyses are described in further detail for specific comparisons within the KQ 1 Results section.

Appendix Figure H-4Forest plots for network meta-analysis of ACR50 response

ACR50 = American College of Rheumatology 50% improvement; MTX = methotrexate; RR = relative risk; vs. = versus; 95% CI = 95% confidence interval

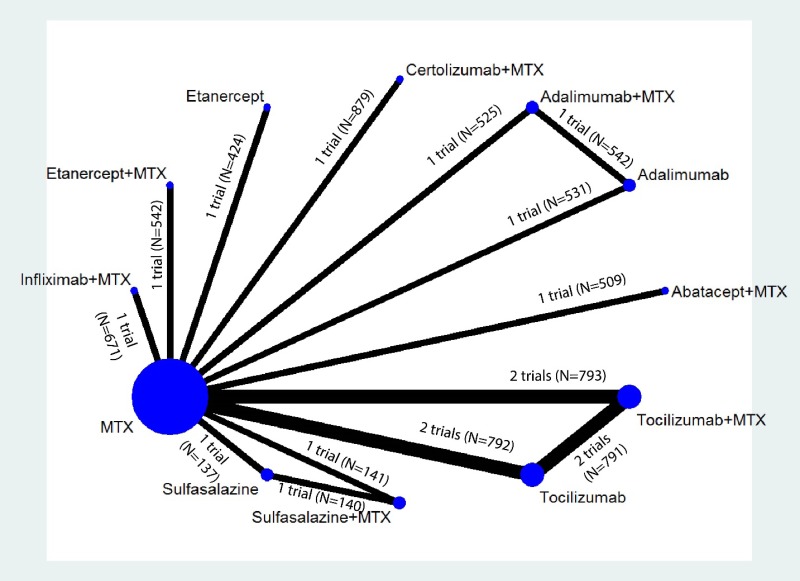
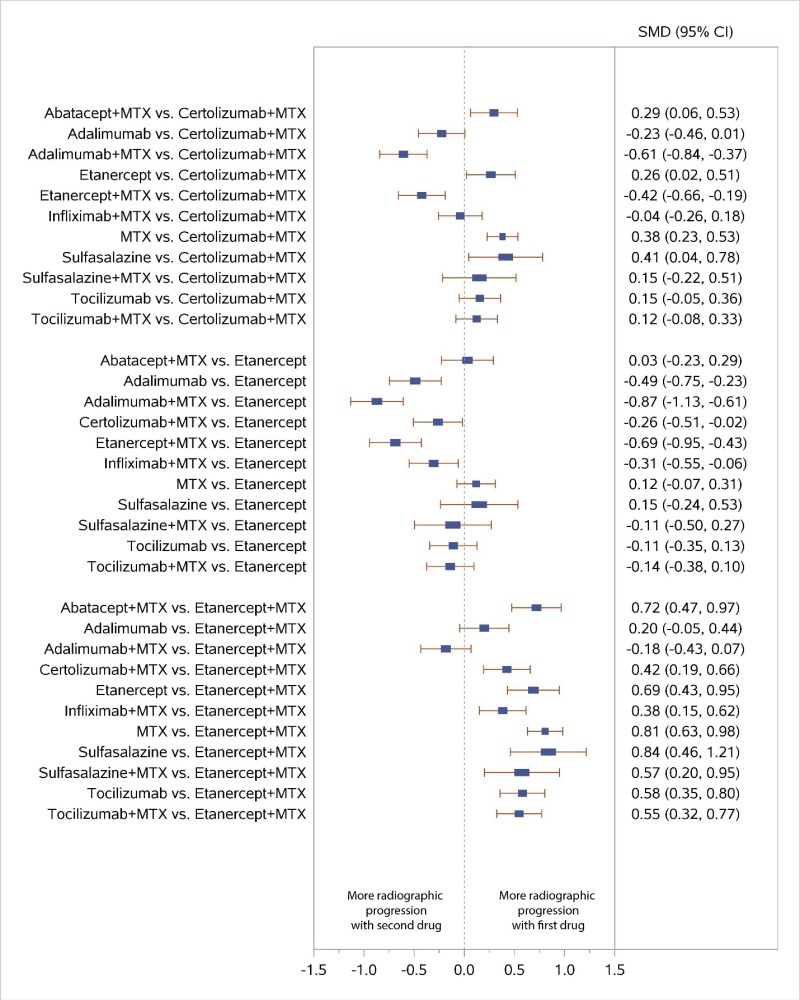
Figure H-5 displays the evidence network for the network meta-analysis for change from baseline in radiographic joint damage score. The diagram graphically displays the number of studies that comprise the evidence base for the analysis and indicates the number of head-to-head and MTX-controlled studies underpinning the pairwise comparisons. The number of trials and participants for each comparison with MTX are as follows: Abatacept plus MTX (1 trial, N=509), Adalimumab (1 trial, N=531), Adalimumab plus MTX (1 trial, N=525), Certolizumab plus MTX (1 trial, N=879), Etanercept (1 trial, N=424), Etanercept plus MTX (1 trial, N=542), Infliximab plus MTX (1 trial, N=671), Sulfasalazine (1 trial, N=137), Sulfasalazine plus MTX (1 trial, N=141), Tocilizumab (2 trials, N=792), and Tocilizumab plus MTX (2 trials, N=793). The number of trials and participants for the head-to-head comparisons are as follows: Adalimumab vs. Adalimumab plus MTX (1 trial, N=542), Sulfasalazine vs. Sulfasalazine plus MTX (1 trial, N=140), and Tocilizumab vs. Tocilizumab plus MTX (2 trials, N=791).

Appendix Figure H-5Network diagram for network meta-analysis: Change from baseline in radiographic joint damage score

MTX = methotrexate; N = number of patients

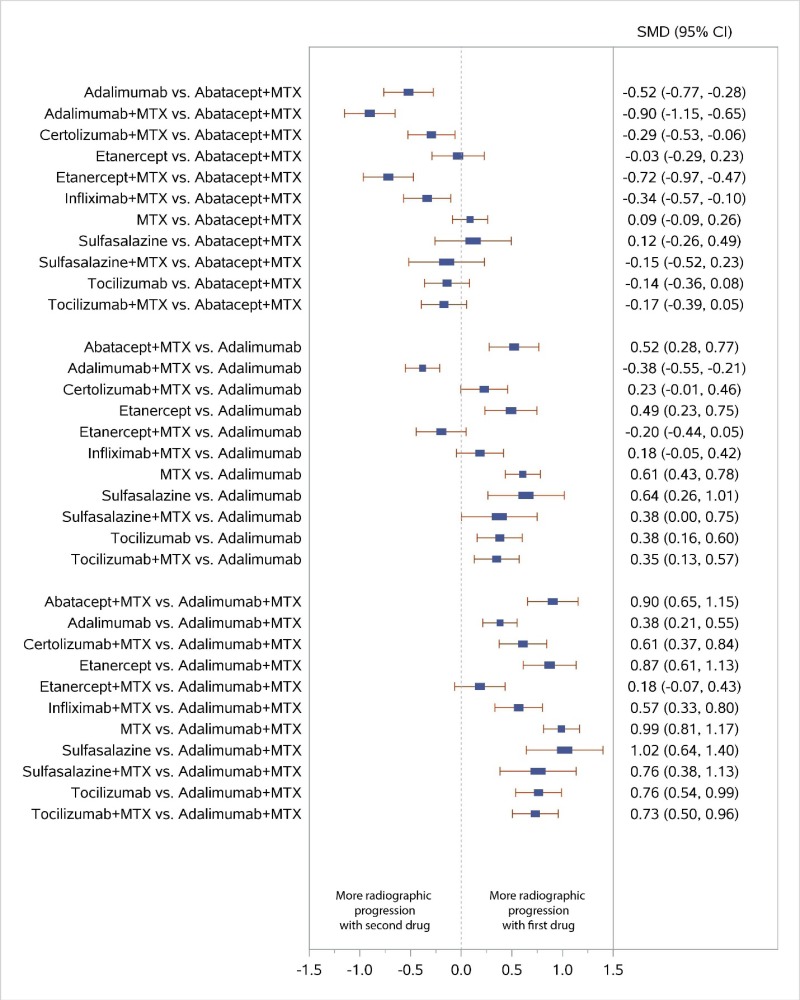
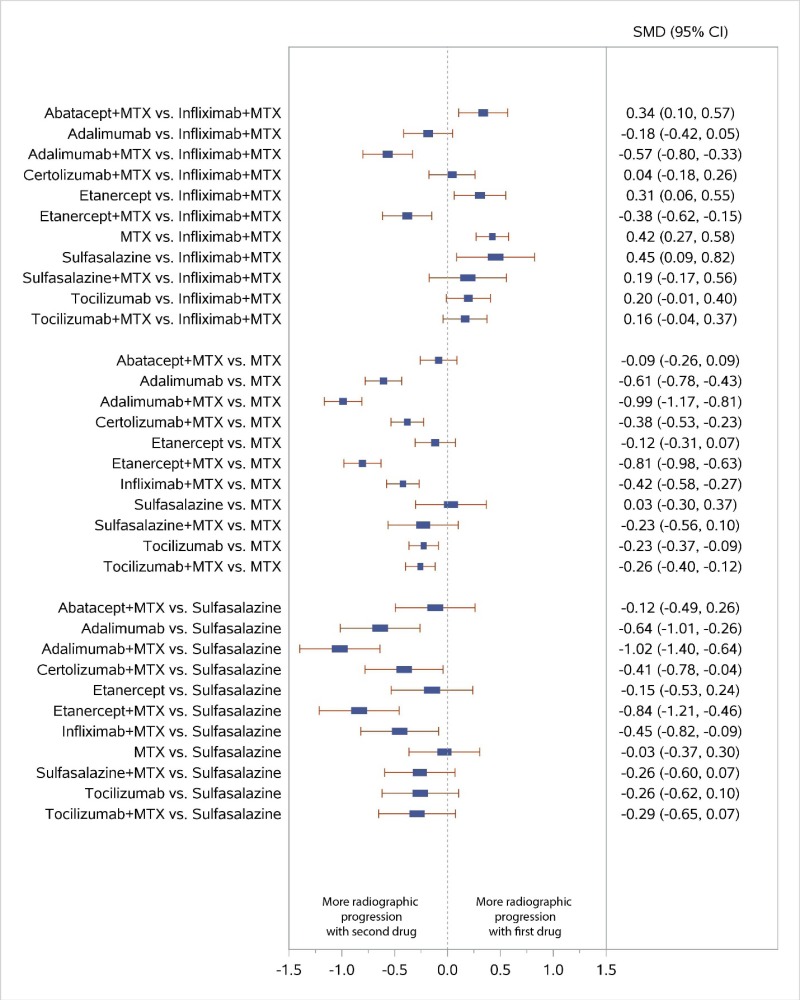
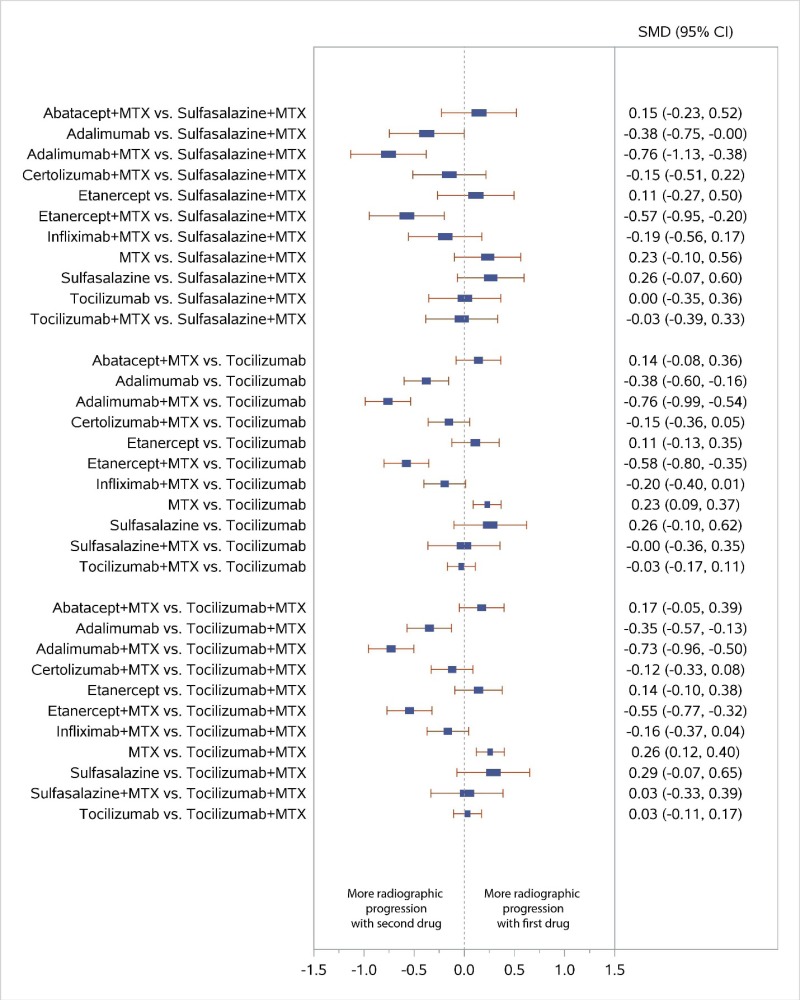
Figure H-6 displays a forest plot for the network meta-analysis of studies reporting data for change from baseline in radiographic joint damage score. Study-level data used in this Figure are presented in Appendix C. The results of this figure’s analyses are described in further detail for specific comparisons within the KQ 1 Results section.

Appendix Figure H-6Forest plots for network meta-analysis: Change from baseline in radiographic joint damage score

MTX = methotrexate; SMD = standardized mean difference; vs. = versus; 95% CI = 95% confidence interval

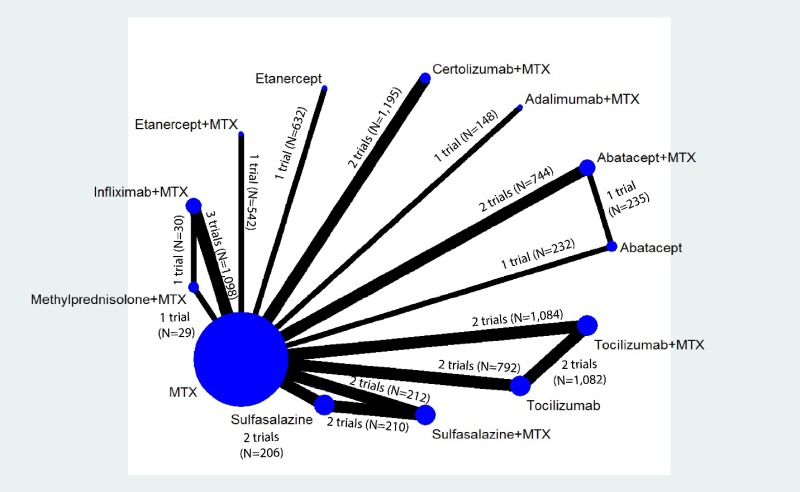
Figure H-7 displays the evidence network for the network meta-analyses of our two discontinuation outcomes: all discontinuations and discontinuations due to adverse events. The diagram graphically displays the number of studies that comprise the evidence base for the analysis and indicates the number of head-to-head and MTX-controlled studies underpinning the pairwise comparisons. The number of trials and participants for each comparison with MTX are as follows: Abatacept (1 trial, N=232), Abatacept plus MTX (2 trials, N=744), Adalimumab plus MTX (1 trial, N=148), Certolizumab plus MTX (2 trials, N=1,195), Etanercept (1 trial, N=632), Etanercept plus MTX (1 trial, N=542), Infliximab plus MTX (3 trials, N=1,098), Methylprednisolone plus MTX (1 trial, N=29), Sulfasalazine (2 trials, N=206), Sulfasalazine plus MTX (2 trials, N=212), Tocilizumab (2 trials, N=792), and Tocilizumab plus MTX (2 trials, N=1,084). The number of trials and participants for the head-to-head comparisons are as follows: Abatacept versus Abatacept plus MTX (1 trial, N=235), Infliximab plus MTX versus Methylprednisolone plus MTX (1 trial, N=30), Sulfasalazine versus Sulfasalazine plus MTX (2 trials, N=210), and Tocilizumab versus Tocilizumab plus MTX (2 trials, N=1,082).

Appendix Figure H-7Network diagram for network meta-analysis: All discontinuations and discontinuations due to adverse events

MTX = methotrexate; N = number of patients

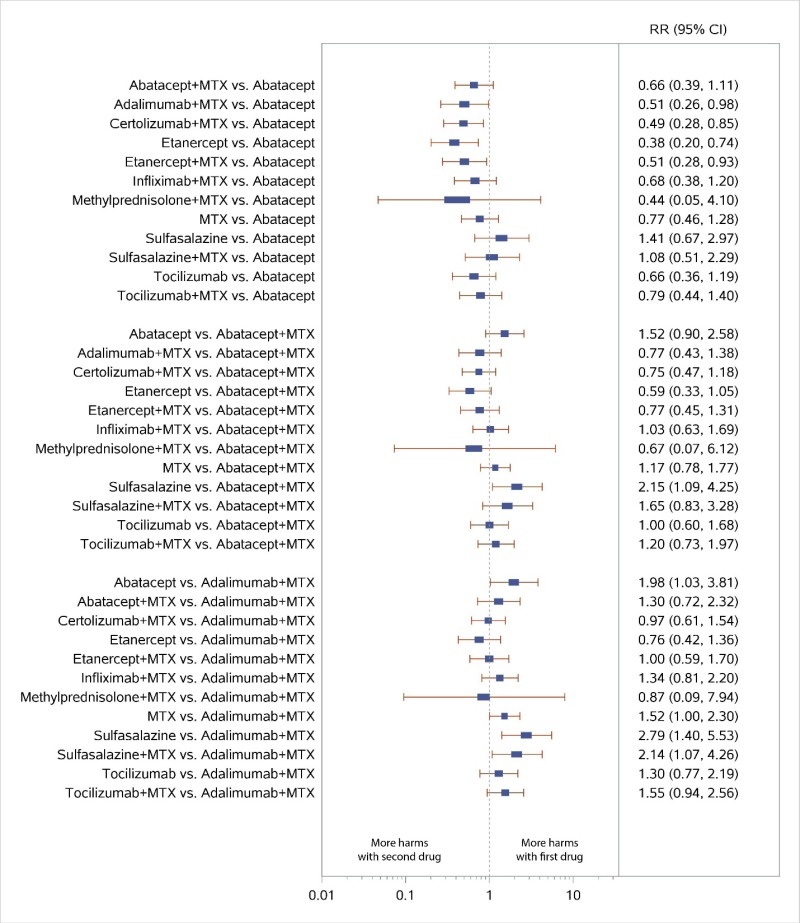
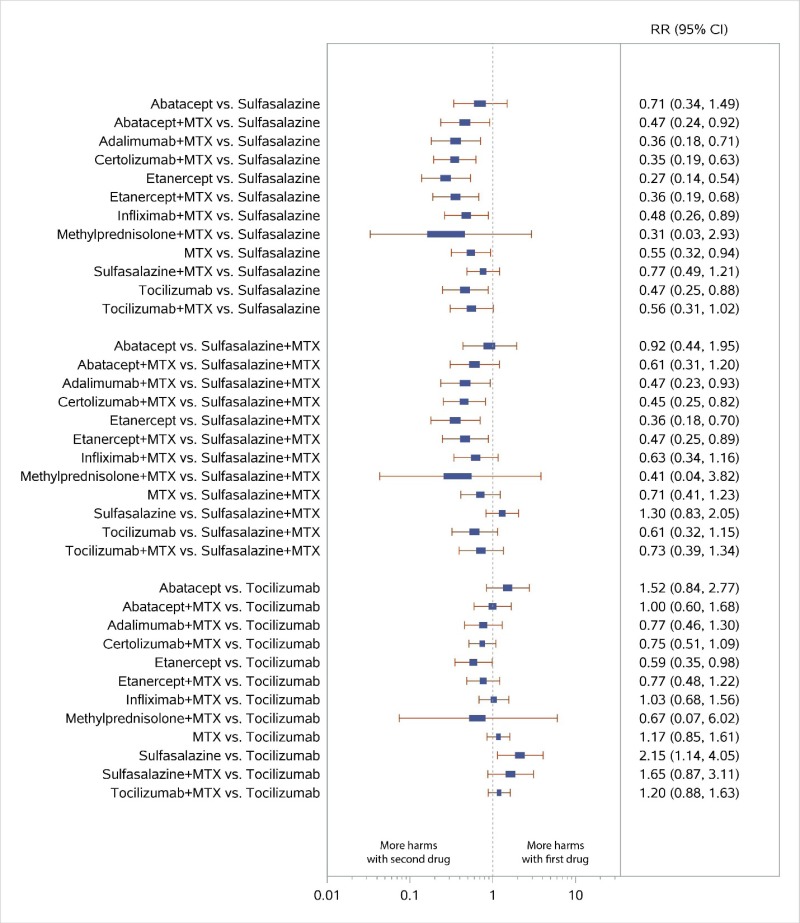
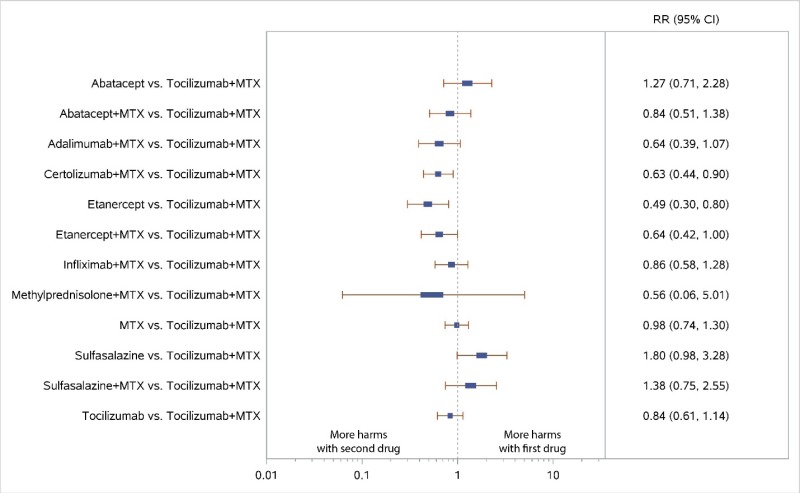
Figure H-8 displays a forest plot for the network meta-analysis of studies reporting data for all discontinuations. Study-level data used in this Figure are presented in Appendix C. The results of this figure’s analyses are described in further detail for specific comparisons within the KQ 3 Results section.

Appendix Figure H-8Forest plots for network meta-analysis: All discontinuations

MTX = methotrexate; RR = relative risk; vs. = versus; 95% CI = 95% confidence interval

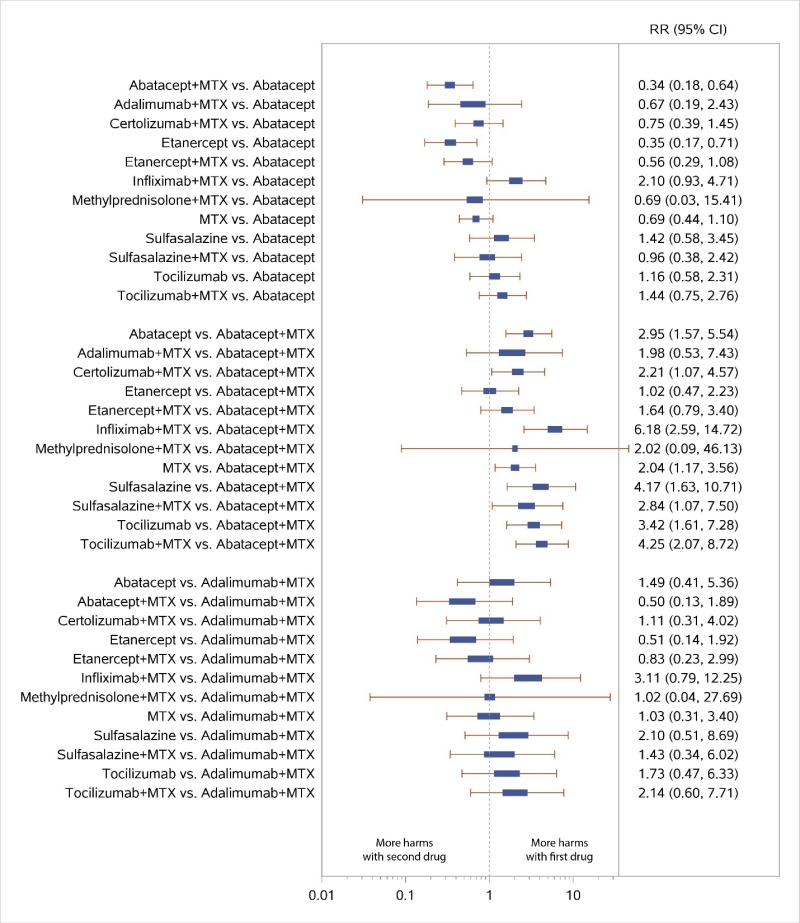
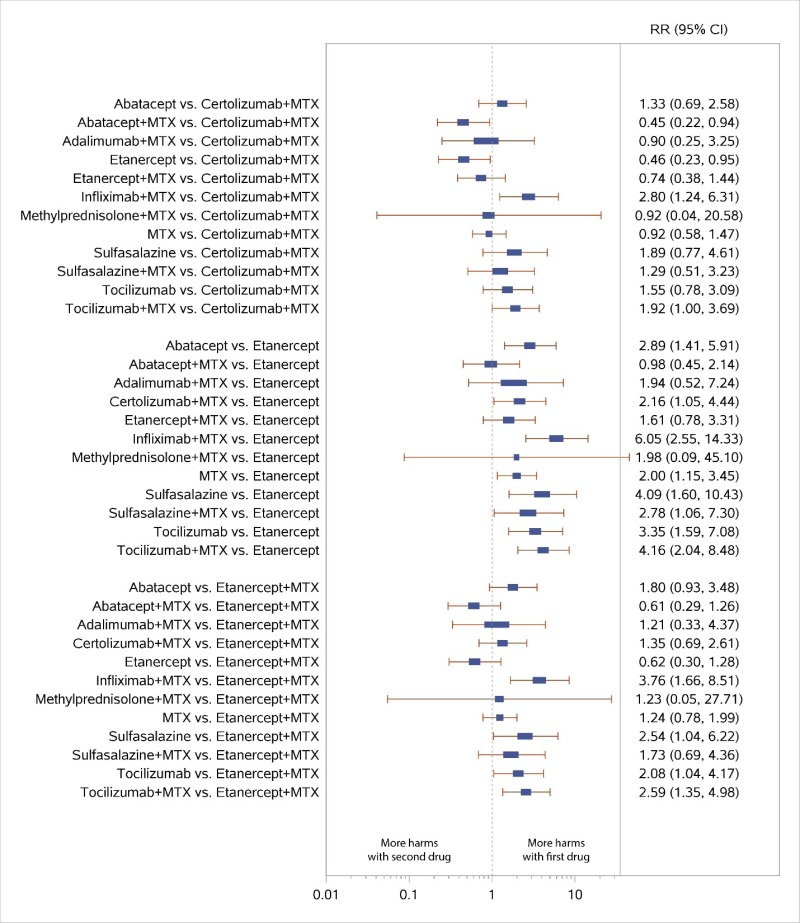
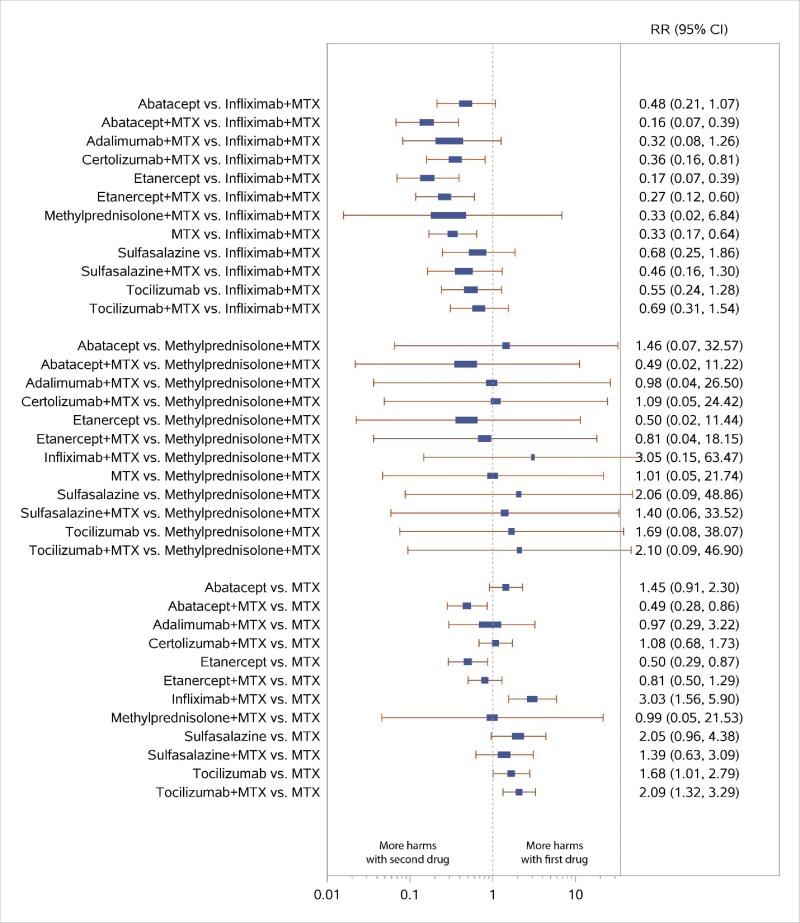
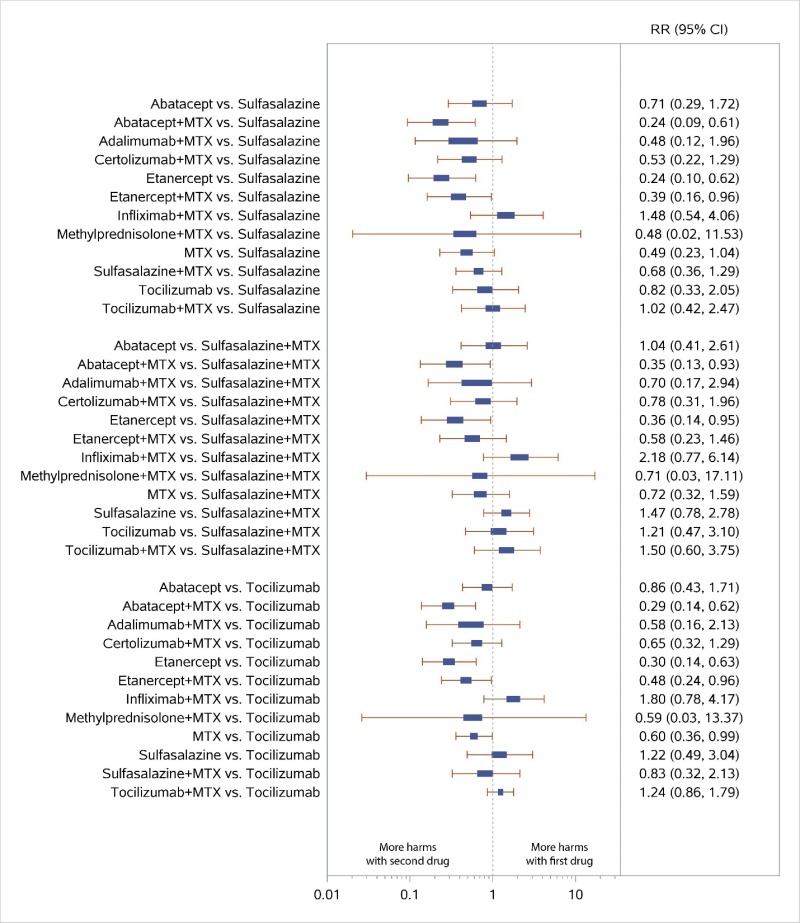
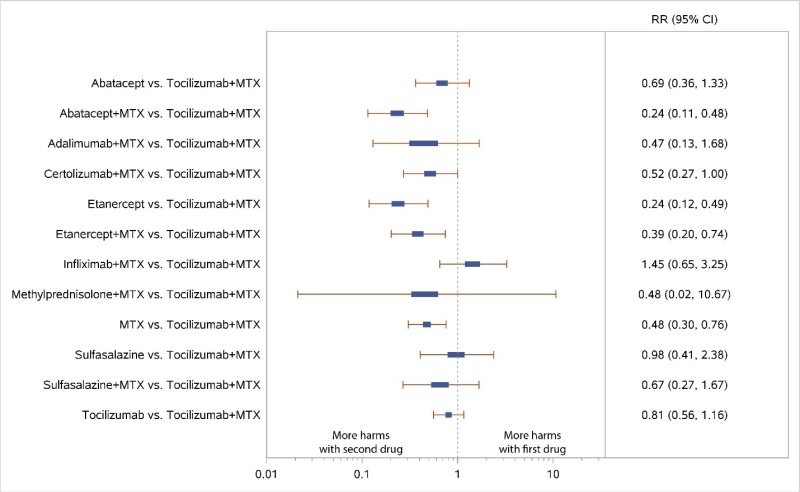
Figure H-9 displays a forest plot for the network meta-analysis of studies reporting data for discontinuations due to adverse events. Study-level data used in this Figure are presented in Appendix C. The results of this figure’s analyses are described in further detail for specific comparisons within the KQ 3 Results section.

Appendix Figure H-9Forest plots for network meta-analysis: Discontinuations due to adverse events

MTX = methotrexate; RR = relative risk; vs. = versus; 95% CI = 95% confidence interval

Views

  • PubReader
  • Print View
  • Cite this Page
  • PDF version of this title (24M)

Other titles in this collection

Recent Activity

Your browsing activity is empty.

Activity recording is turned off.

Turn recording back on

See more...