U.S. flag

An official website of the United States government

NCBI Bookshelf. A service of the National Library of Medicine, National Institutes of Health.

Donahue KE, Gartlehner G, Schulman ER, et al. Drug Therapy for Early Rheumatoid Arthritis: A Systematic Review Update [Internet]. Rockville (MD): Agency for Healthcare Research and Quality (US); 2018 Jul. (Comparative Effectiveness Review, No. 211.)
Cover of Drug Therapy for Early Rheumatoid Arthritis: A Systematic Review Update

Drug Therapy for Early Rheumatoid Arthritis: A Systematic Review Update [Internet].

Show details

Appendix ISensitivity Analyses for Network Meta-Analyses

Sensitivity Analyses for Network Meta-Analyses

We identified a total of 14 studies with a low or medium risk of bias for use in our main network meta-analyses (NWMA) comparing the efficacy of drug therapies for early rheumatoid arthritis. Those findings are presented in our main report.

An additional two studies provided data eligible for inclusion in these analyses but were rated as high risk of bias.13, 16 We re-ran our NWMA including these studies for our sensitivity analyses. Estimates for the treatment comparisons were very similar to estimates from our main analyses excluding those studies. We present these findings below, first for our tests of consistency and then the network diagrams and forest plots depicting effect estimates for specific drug comparisons.

Tests of Consistency: Models Including High Risk of Bias Studies

To test for consistency, we compared consistency and inconsistency models. In addition, where there were closed loops in the network diagram with both direct and indirect evidence available, we examined differences in results between direct and indirect evidence using network sidesplits.

ACR50 Response

For the ACR50 outcome (see Appendix Table I-1), there was no significant difference in the consistency and inconsistency models (χ2(3)=0.48, p=0.922). Results did not differ significantly between direct and indirect evidence for (1) Abatacept versus Abatacept plus Methotrexate (MTX) (coefficient [95% CI]= −0.09 [−0.69 to 0.52], p=0.777), (2) Adalimumab versus Adalimumab plus MTX (coefficient [95% CI]=0.17 [−0.55 to 0.89], p=0.644), or (3) Infliximab plus MTX versus Methylprednisolone plus MTX (coefficient [95% CI]= −0.37 [−1.99 to 1.25], p=0.653).

Remission According to Disease Activity Score

For the DAS outcome (see Appendix Table I-2), there was no significant difference in the consistency and inconsistency models (χ2(2)=1.66, p=0.646). Results did not differ significantly between direct and indirect evidence for (1) Abatacept versus Abatacept + MTX (coefficient (95% CI)= −0.60 (−2.09, 0.89), p=0.428), or (2) Adalimumab versus Adalimumab + MTX (coefficient (95% CI)= −0.44 (−2.56 to 1.68), p=0.685).

Appendix Table I-1Table with network sidesplits: ACR50 Response

Drug ADrug BDirect Coefficient95% CIpIndirect Coefficient95% CIpCoefficient Difference95% CIp
AbataceptAbatacept + MTX0.16−0.07, 0.380.1780.24−0.33, 0.820.406−0.09−0.69, 0.520.777
AdalimumabAdalimumab + MTX0.420.25, 0.59<0.0010.25−0.47, 0.960.5030.17−0.55, 0.890.644
Infliximab+MTXMethylprednisolone+ MTX0.00−0.51, 0.511.0000.37−1.17, 1.910.636−0.37−1.99, 1.250.653

ACR50 = American College of Rheumatology 50% response; CI = confidence interval; MTX = methotrexate

Appendix Table I-2Table with network sidesplits: Remission according to Disease Activity Score

Drug ADrug BDirect Coefficient95% CIpIndirect Coefficient95% CIpCoefficient Difference95% CIp
AbataceptAbatacept + MTX0.35−0.18, 0.880.1920.95−0.45, 2.360.184−0.60−2.09, 0.890.428
Infliximab+MTXMethylprednisolone+ MTX0.10−0.56, 0.750.7770.53−1.47, 2.540.600−0.44−2.56, 1.680.685

CI = confidence interval; MTX = methotrexate

Network Diagrams and Forest Plots

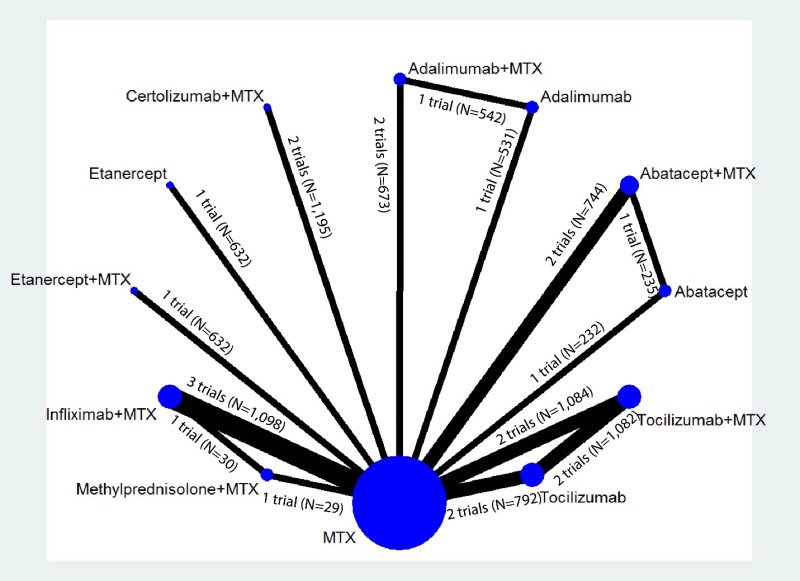
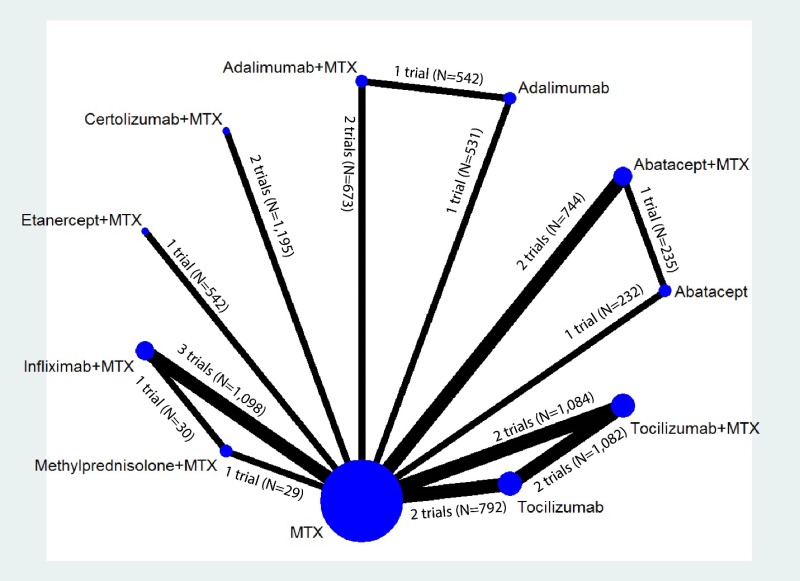
Figure I-1 displays the evidence network for the ACR50 network meta-analysis. The diagram graphically displays the number of studies that comprise the evidence base for the analysis and indicates the number of head-to-head and MTX-controlled studies underpinning the pairwise comparisons. The number of trials and participants for each comparison with MTX are as -follows: Abatacept (1 trial, N=232), Abatacept plus MTX (2 trials, N=744), Adalimumab (1 trial, N=531), Adalimumab plus MTX (2 trials, N=673), Certolizumab plus MTX (2 trials, N=1,195), Etanercept (1 trial, N=632), Etanercept plus MTX (1 trial, N=632), Infliximab plus MTX (3 trials, N=1,098), Methylprednisolone plus MTX (1 trial, N=29), Tocilizumab (2 trials, N=792), and Tocilizumab plus MTX (2 trials, N=1,084). The number of trials and participants for the head-to-head comparisons are as follows: Abatacept vs. Abatacept plus MTX (1 trial, N=235), Adalimumab vs. Adalimumab plus MTX (1 trial, N=542), Infliximab plus MTX vs. Methylprednisolone plus MTX (1 trial, N=30), and Tocilizumab vs. Tocilizumab plus MTX (2 trials, N=1,082).

Appendix Figure I-1Network diagram for network meta-analysis (sensitivity analysis): ACR50 response

MTX = methotrexate; N = number of patients

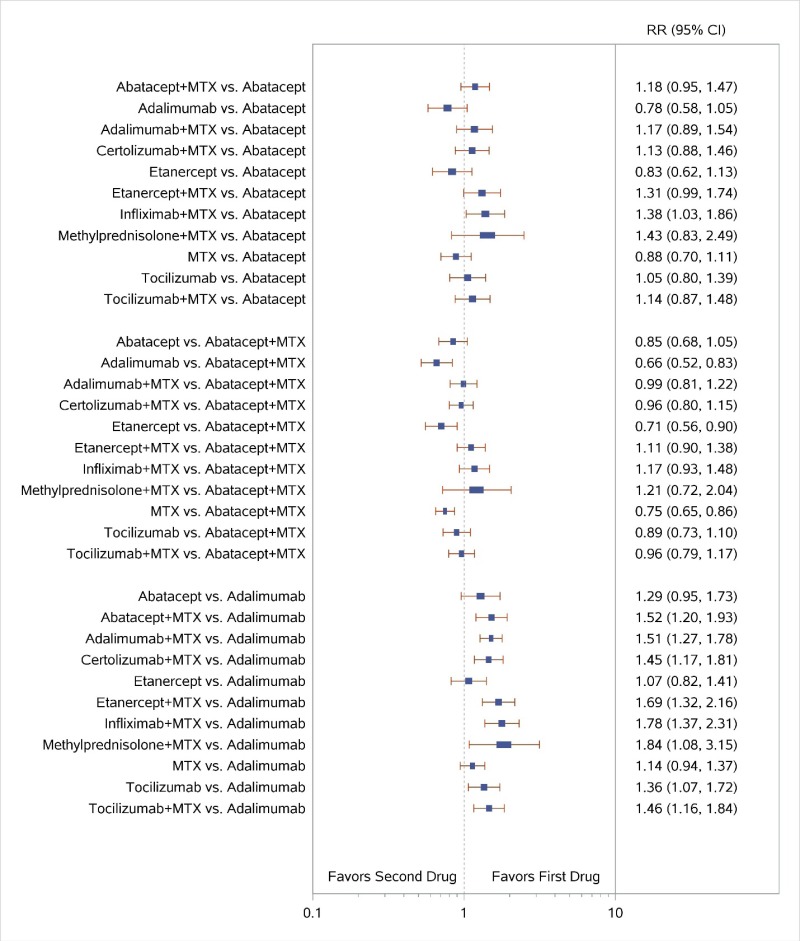
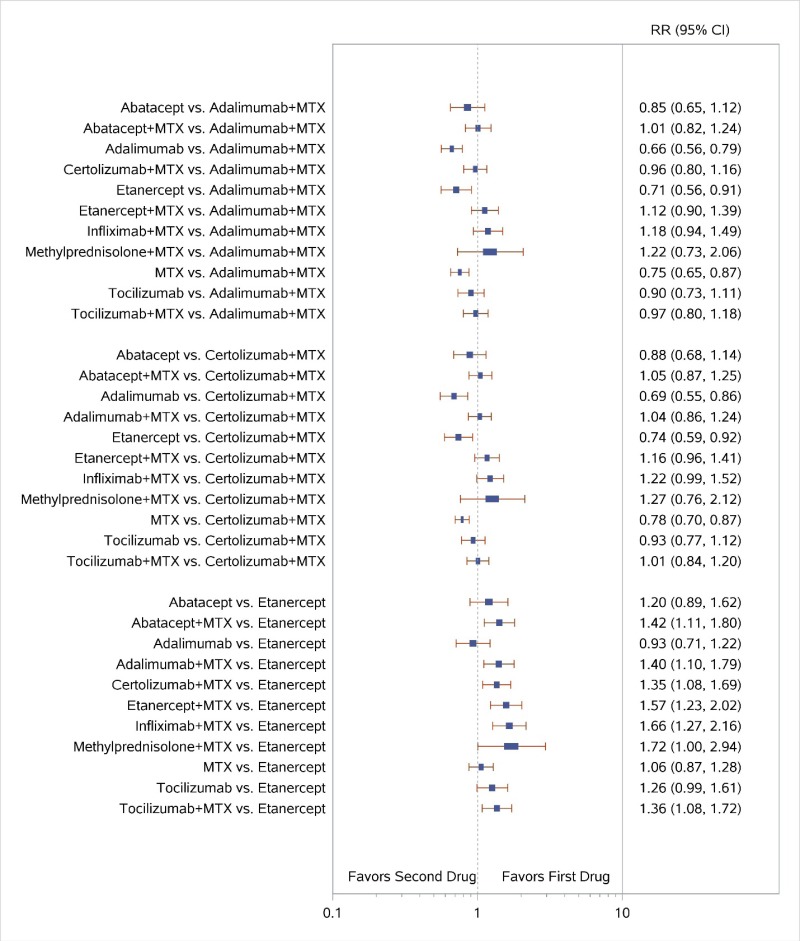
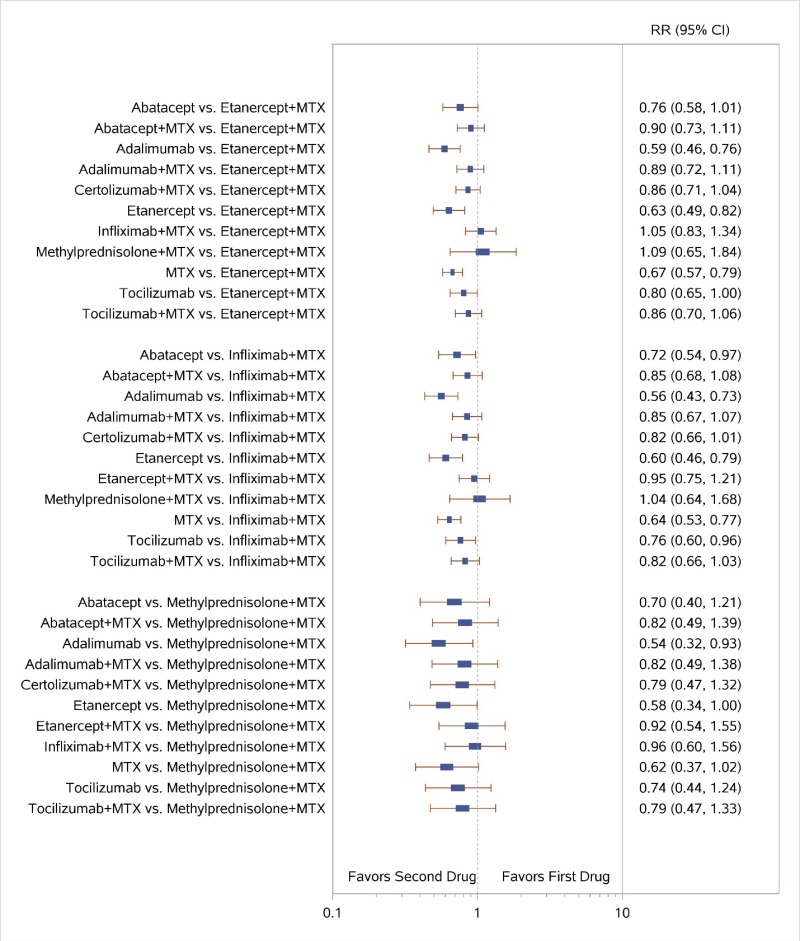
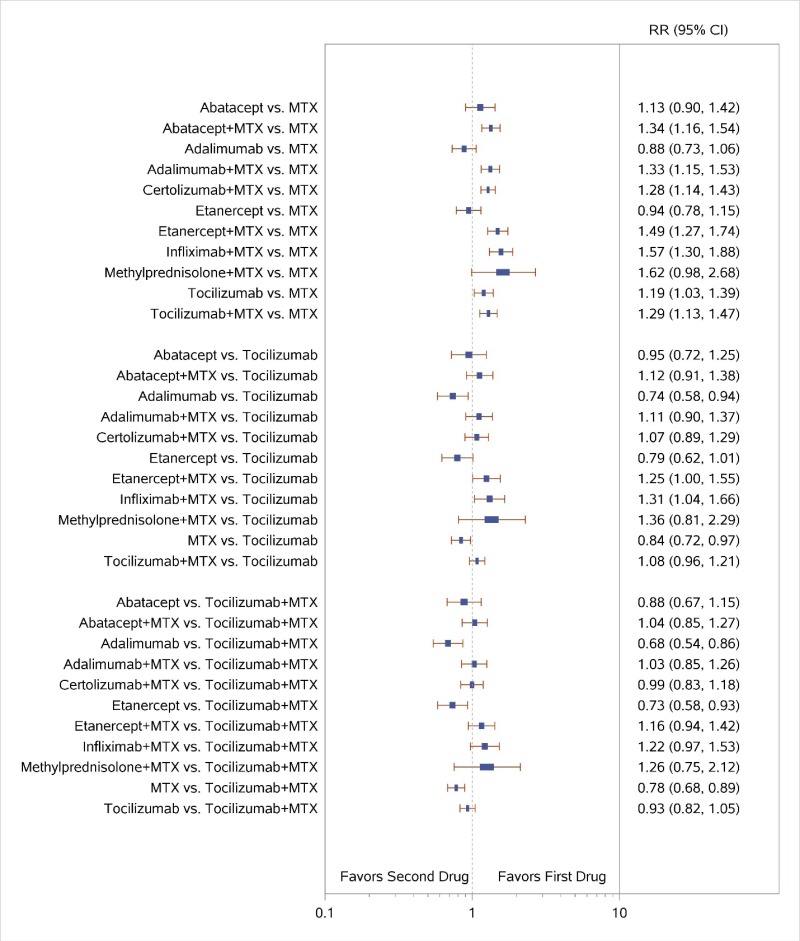
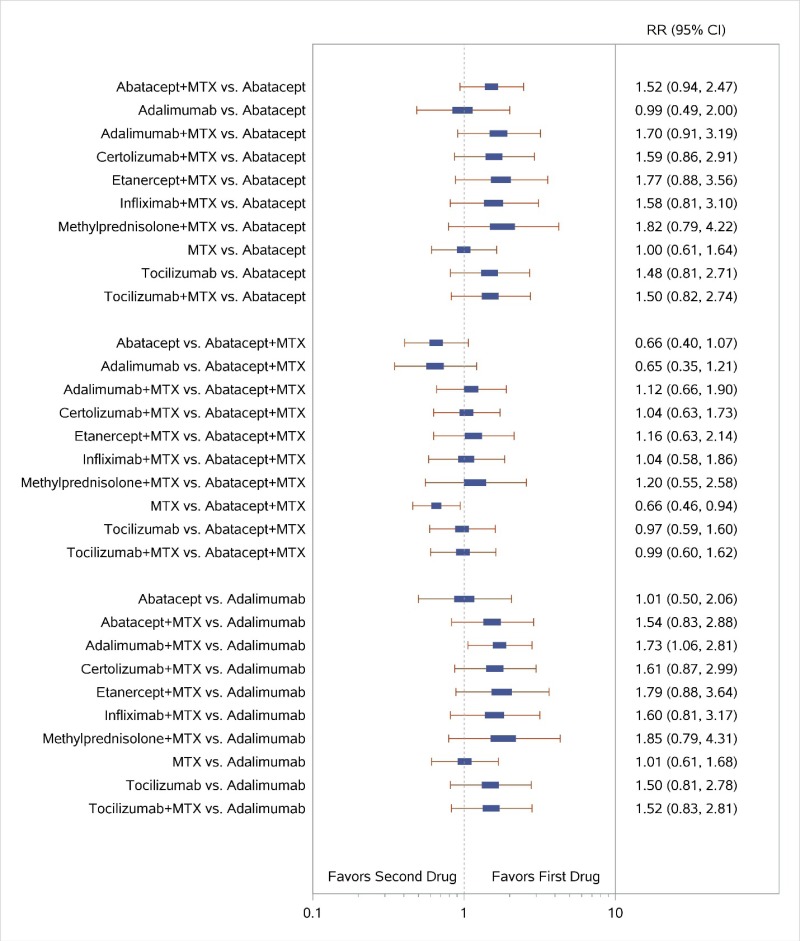
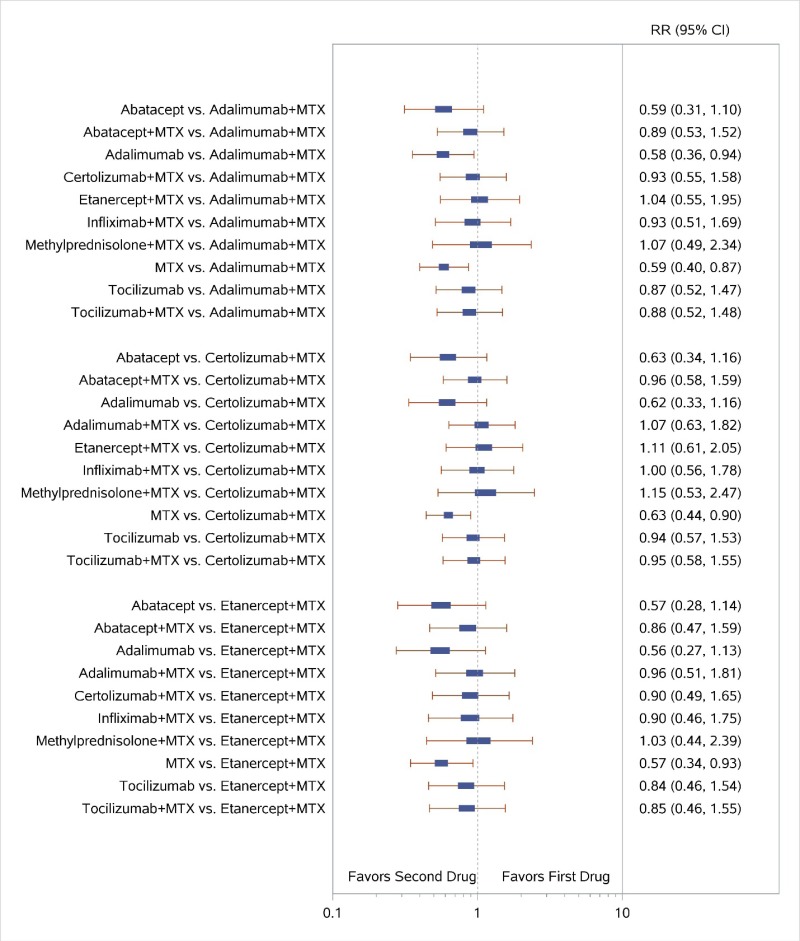
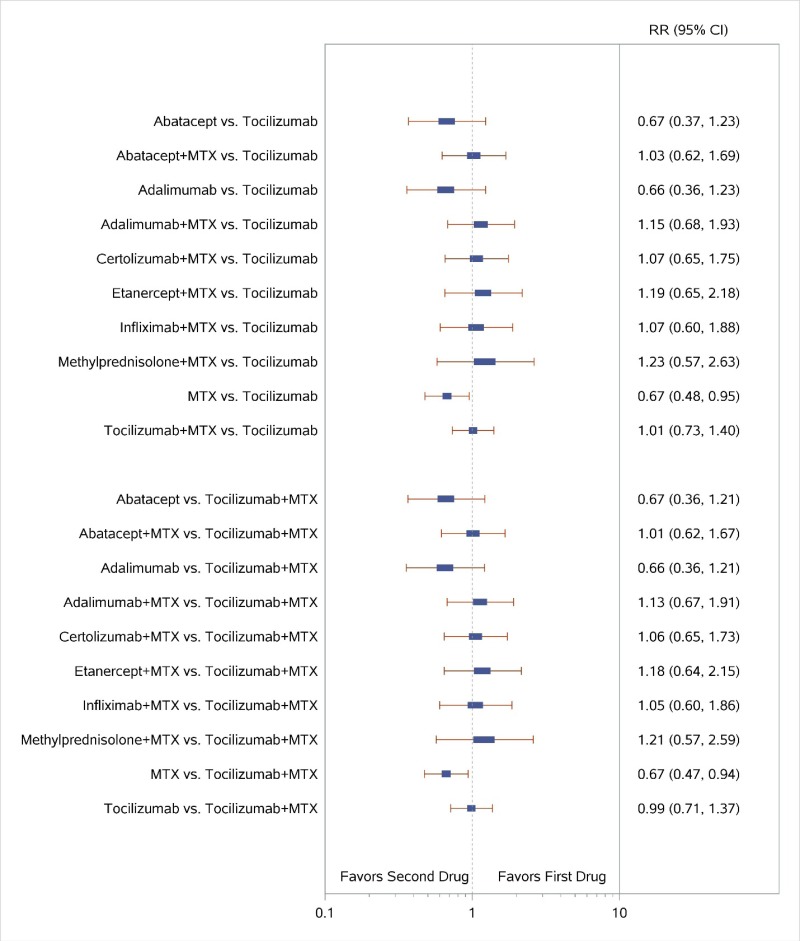
Figure I-2 displays a forest plot for the sensitivity analysis of studies reporting data for ACR50 response rates, including studies with a high risk of bias. Study-level data used in this Figure are presented in Appendix C. We repeated the network meta-analyses (NWMA) including two studies with high risk of bias as a sensitivity analysis: another eligible study of CZP plus MTX and another study of ADA plus MTX. This figure is described further in Appendix I as follows: “Estimates for the treatment comparisons were very similar to estimates from our main analyses excluding those studies”.

Appendix Figure I-2Forest plots for network meta-analysis (sensitivity analysis): ACR50 response

ACR50 = American College of Rheumatology 50% improvement; MTX = methotrexate; RR = relative risk; vs. = versus; 95% CI = 95% confidence interval

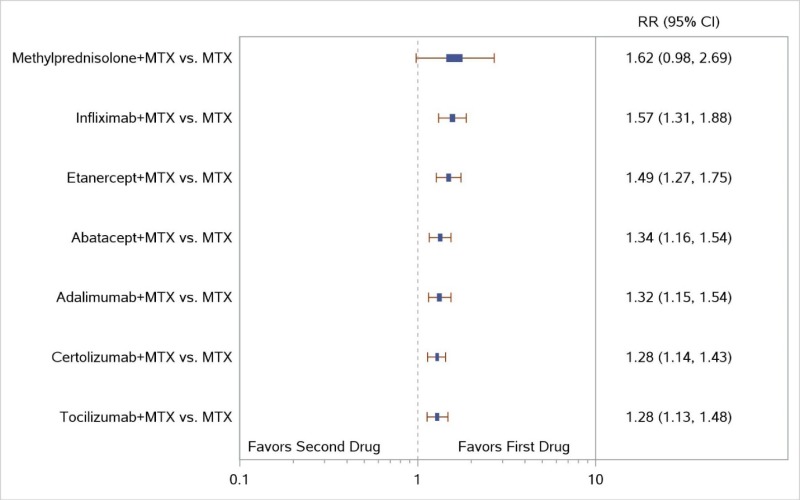
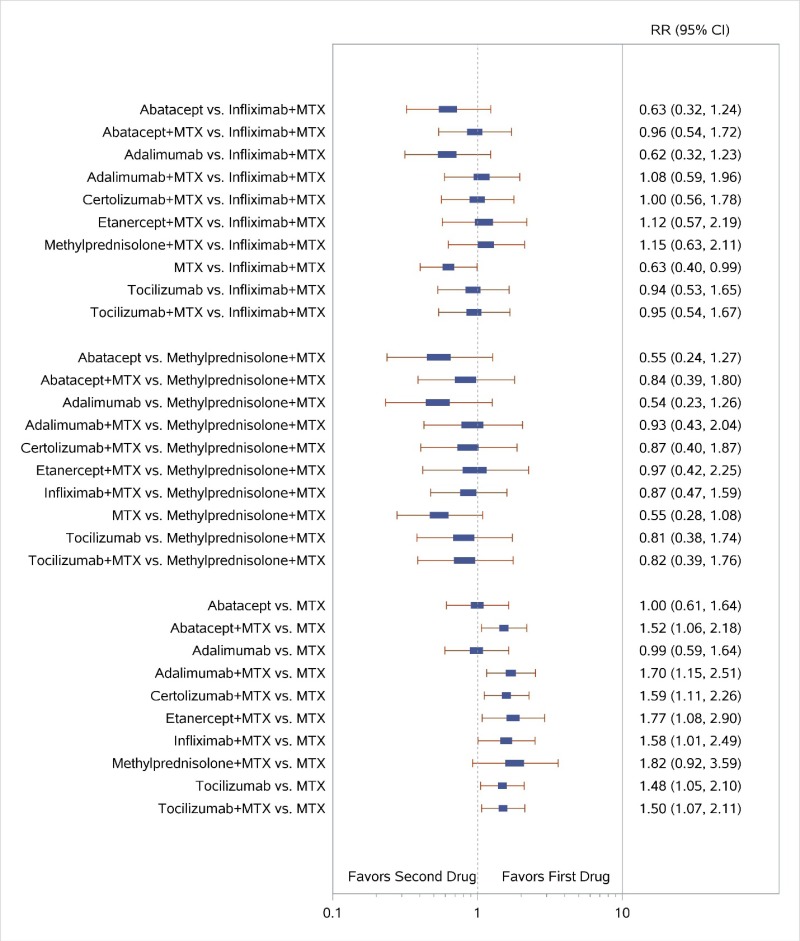
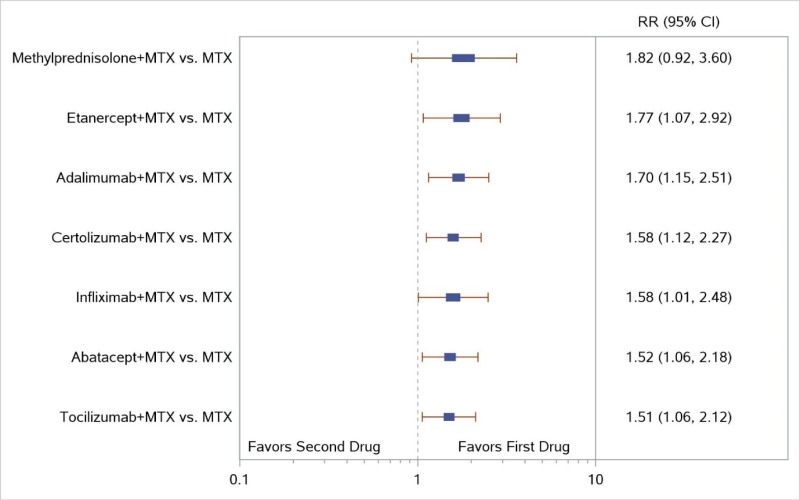
Figure I-3 displays a forest plot for the sensitivity analysis of studies comparing combination therapies with various drugs and MTX versus MTX only and reporting data for ACR50 response rates, including studies with a high risk of bias. Study-level data used in this Figure are presented in Appendix C. We repeated the network meta-analyses (NWMA) including two studies with high risk of bias as a sensitivity analysis: another eligible study of CZP plus MTX and another study of ADA plus MTX. This figure is described further in Appendix I as follows: “Estimates for the treatment comparisons were very similar to estimates from our main analyses excluding those studies”.

Appendix Figure I-3Forest plots for network meta-analysis (sensitivity analysis) of ACR50 response: Comparison of combined therapies to MTX only

ACR50 = American College of Rheumatology 50% improvement; MTX = methotrexate; RR = relative risk; vs. = versus; 95% CI = 95% confidence interval

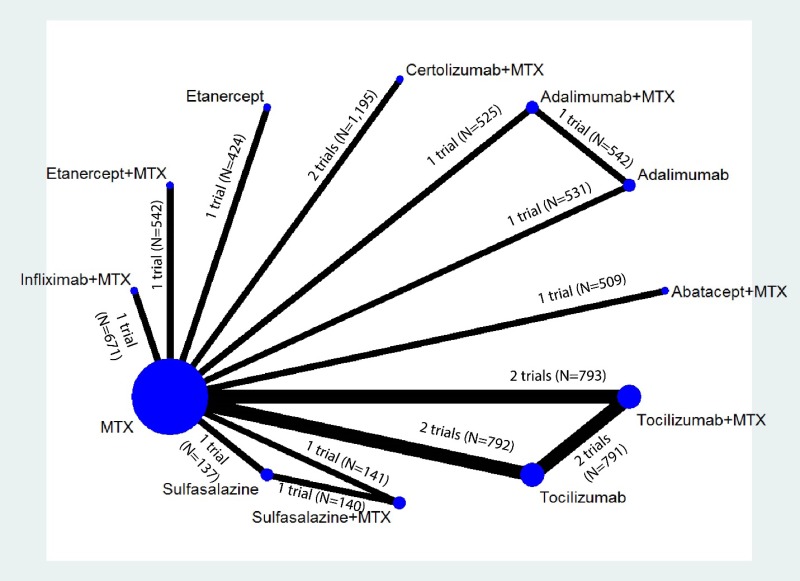
Figure I-4 displays the evidence network for the network meta-analysis for change from baseline in radiographic joint damage score. The diagram graphically displays the number of studies that comprise the evidence base for the analysis and indicates the number of head-to-head and MTX-controlled studies underpinning the pairwise comparisons. The number of trials and participants for each comparison with MTX are as follows: Abatacept plus MTX (1 trial, N=509), Adalimumab (1 trial, N=531), Adalimumab plus MTX (1 trial, N=525), Certolizumab plus MTX (2 trials, N=1,195), Etanercept (1 trial, N=424), Etanercept plus MTX (1 trial, N=542), Infliximab plus MTX (1 trial, N=671), Sulfasalazine (1 trial, N=137), Sulfasalazine plus MTX (1 trial, N=141), Tocilizumab (2 trials, N=792), and Tocilizumab plus MTX (2 trials, N=793). The number of trials and participants for the head-to-head comparisons are as follows: Adalimumab vs. Adalimumab plus MTX (1 trial, N=542), Sulfasalazine vs. Sulfasalazine plus MTX (1 trial, N=140), and Tocilizumab vs. Tocilizumab plus MTX (2 trials, N=791).

Appendix Figure I-4Network diagram for network meta-analysis (sensitivity analysis): Change from baseline in radiographic joint damage score

MTX = methotrexate; N = number of patients

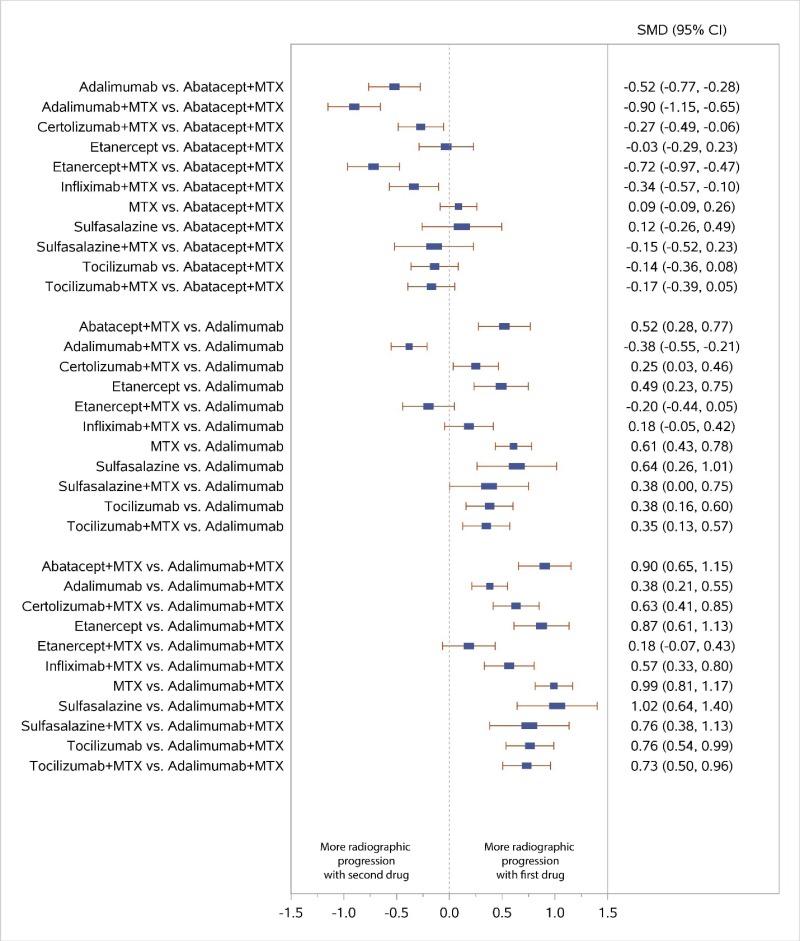
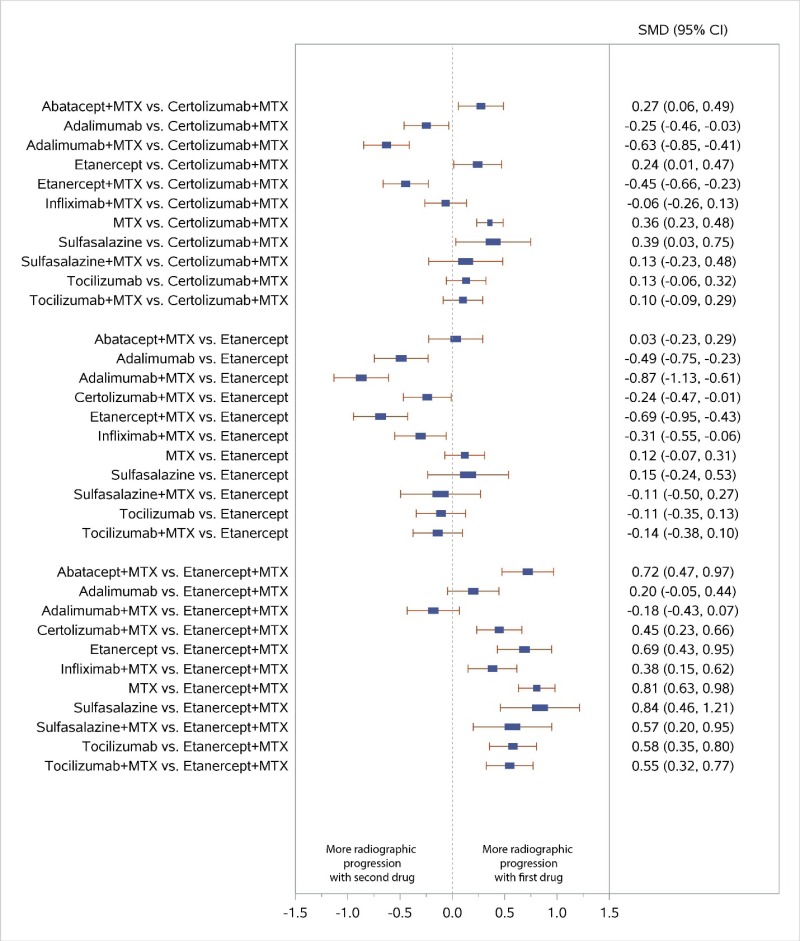
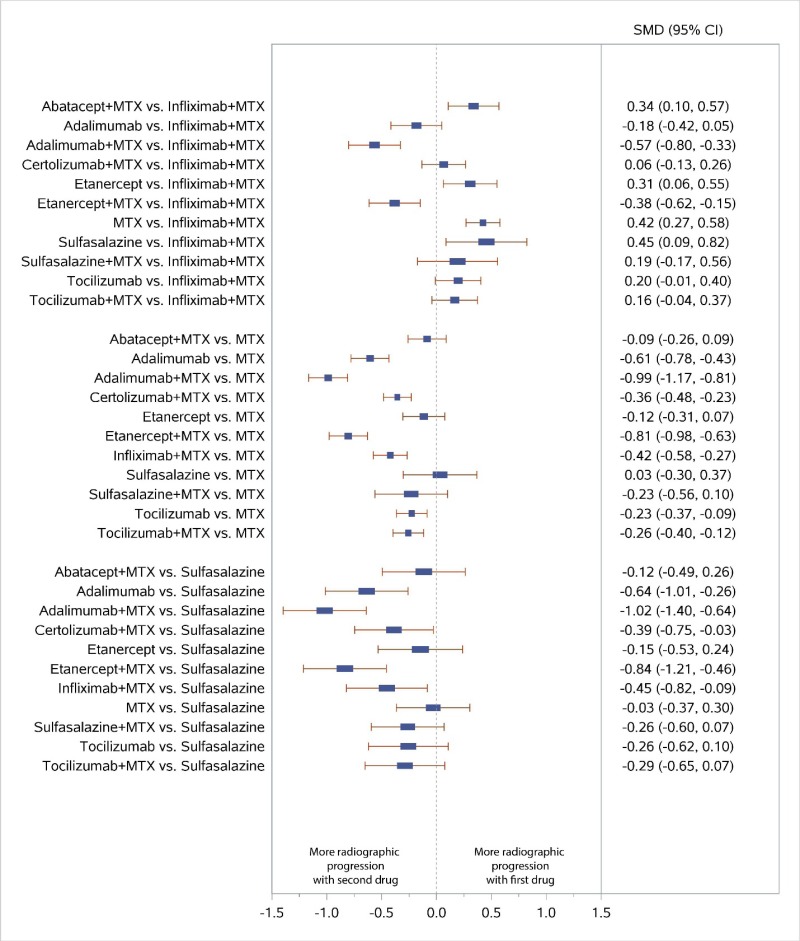
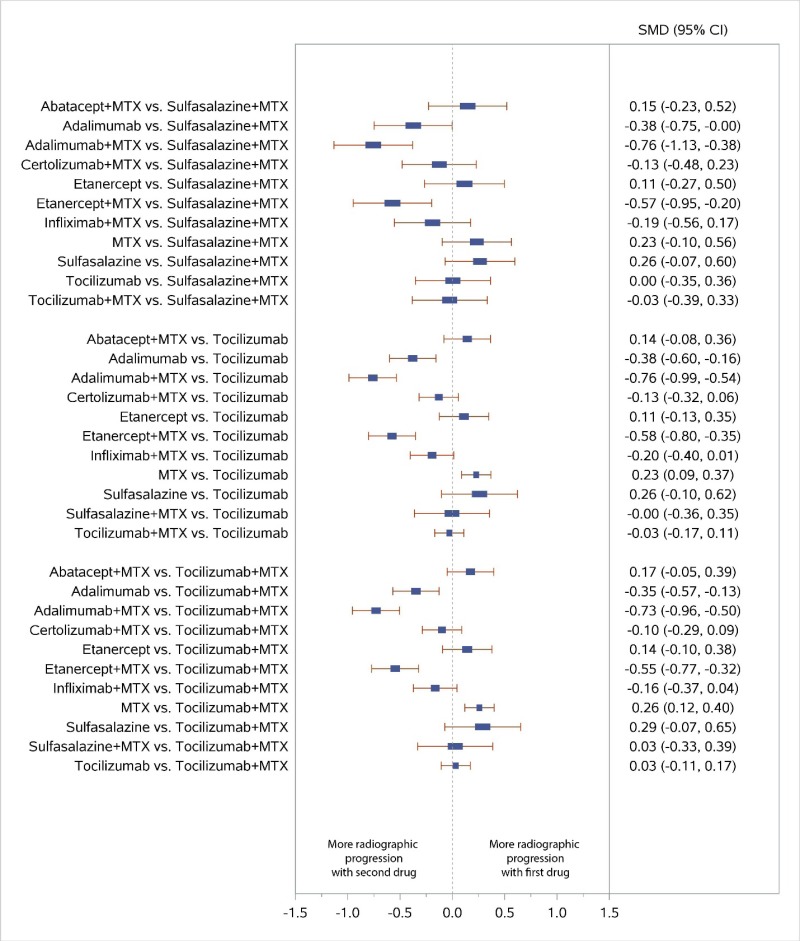
Figure I-5 displays a forest plot for the sensitivity analysis of studies reporting data for change from baseline in radiographic joint damage score, including studies with a high risk of bias. Study-level data used in this Figure are presented in Appendix C. We repeated the network meta-analyses (NWMA) including one study of CZP plus MTX with high risk of bias as a sensitivity analysis. This figure is described further in Appendix I as follows: “Estimates for the treatment comparisons were very similar to estimates from our main analyses excluding those studies”.

Appendix Figure I-5Forest plots for network meta-analysis (sensitivity analysis): Change from baseline in radiographic joint damage score

MTX = methotrexate; SMD = standardized mean difference; vs. = versus; 95% CI = 95% confidence interval

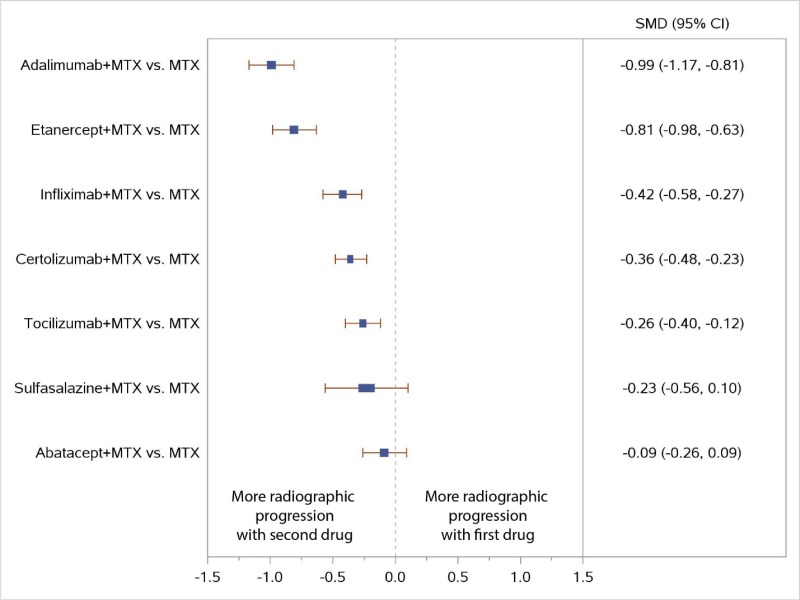
Figure I-6 displays a forest plot for the sensitivity analysis of studies comparing combination therapies with various drugs and MTX versus MTX only and reporting data for change from baseline in radiographic joint damage score, including studies with a high risk of bias. Study-level data used in this Figure are presented in Appendix C. We repeated the network meta-analysis (NWMA) including one study of CZP plus MTX with high risk of bias as a sensitivity analysis. This figure is described further in Appendix I as follows: “Estimates for the treatment comparisons were very similar to estimates from our main analyses excluding those studies”.

Appendix Figure I-6Forest plots for network meta-analysis (sensitivity analysis) of change from baseline in radiographic joint damage score: Comparison of combined therapies to MTX only

MTX = methotrexate; SMD = standardized mean difference; vs. = versus; 95% CI = 95% confidence interval

Figure I-7 displays the evidence network for the network meta-analysis for remission according to Disease Activity Score. The diagram graphically displays the number of studies that comprise the evidence base for the analysis and indicates the number of head-to-head and MTX-controlled studies underpinning the pairwise comparisons. The number of trials and participants for each comparison with MTX are as follows: Abatacept (1 trial, N=232), Abatacept plus MTX (2 trials, N=744), Adalimumab (1 trial, N=531), Adalimumab plus MTX (2 trials, N=673), Certolizumab plus MTX (2 trials, N=1,195), Etanercept plus MTX (1 trial, N=542), Infliximab plus MTX (3 trials, N=1,098), Methylprednisolone plus MTX (1 trial, N=29), Tocilizumab (2 trials, N=792), and Tocilizumab plus MTX (2 trials, N=1,084). The number of trials and participants for the head-to-head comparisons are as follows: Abatacept vs. Abatacept plus MTX (1 trial, N=235), Adalimumab vs. Adalimumab plus MTX (1 trial, N=542), Infliximab plus MTX vs. Methylprednisolone plus MTX (1 trial, N=30), and Tocilizumab vs. Tocilizumab plus MTX (2 trials, N=1,082).

Appendix Figure I-7Network diagram for network meta-analysis (sensitivity analysis): Remission according to Disease Activity Score

MTX = methotrexate; N = number of patients

Figure I-8 displays a forest plot for the sensitivity analysis of studies reporting data for remission according to Disease Activity Score, including studies with a high risk of bias. Study-level data used in this Figure are presented in Appendix C. We repeated the network meta-analyses (NWMA) including two studies with high risk of bias as a sensitivity analysis: another eligible study of CZP plus MTX and another study of ADA plus MTX. This figure is described further in Appendix I as follows: “Estimates for the treatment comparisons were very similar to estimates from our main analyses excluding those studies”.

Appendix Figure I-8Forest plots for network meta-analysis (sensitivity analysis): Remission according to Disease Activity Score

MTX = methotrexate; RR = relative risk; vs. = versus; 95% CI = 95% confidence interval

Figure I-9 displays a forest plot for the sensitivity analysis of studies comparing combination therapies with various drugs and MTX versus MTX only and reporting data for remission according to Disease Activity Score, including studies with a high risk of bias. Study-level data used in this Figure are presented in Appendix C. We repeated the network meta-analyses (NWMA) including two studies with high risk of bias as a sensitivity analysis: another eligible study of CZP plus MTX and another study of ADA plus MTX. This figure is described further in Appendix I as follows: “Estimates for the treatment comparisons were very similar to estimates from our main analyses excluding those studies”.

Appendix Figure I-9Forest plots for network meta-analysis (sensitivity analysis) of remission according to Disease Activity Score: Comparison of combined therapies to MTX only

MTX = methotrexate; RR = relative risk; vs. = versus; 95% CI = 95% confidence interval

Views

  • PubReader
  • Print View
  • Cite this Page
  • PDF version of this title (24M)

Other titles in this collection

Recent Activity

Your browsing activity is empty.

Activity recording is turned off.

Turn recording back on

See more...