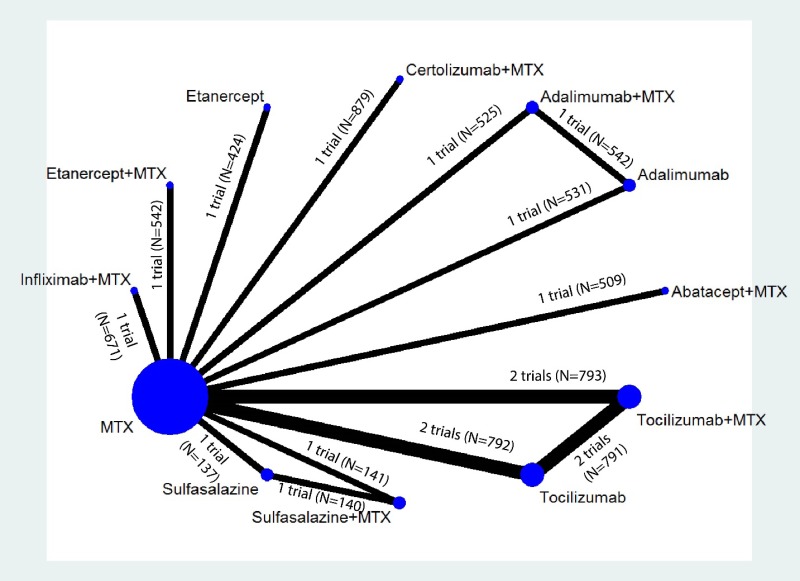
Figure H-5 displays the evidence network for the network meta-analysis for change from baseline in radiographic joint damage score. The diagram graphically displays the number of studies that comprise the evidence base for the analysis and indicates the number of head-to-head and MTX-controlled studies underpinning the pairwise comparisons. The number of trials and participants for each comparison with MTX are as follows: Abatacept plus MTX (1 trial, N=509), Adalimumab (1 trial, N=531), Adalimumab plus MTX (1 trial, N=525), Certolizumab plus MTX (1 trial, N=879), Etanercept (1 trial, N=424), Etanercept plus MTX (1 trial, N=542), Infliximab plus MTX (1 trial, N=671), Sulfasalazine (1 trial, N=137), Sulfasalazine plus MTX (1 trial, N=141), Tocilizumab (2 trials, N=792), and Tocilizumab plus MTX (2 trials, N=793). The number of trials and participants for the head-to-head comparisons are as follows: Adalimumab vs. Adalimumab plus MTX (1 trial, N=542), Sulfasalazine vs. Sulfasalazine plus MTX (1 trial, N=140), and Tocilizumab vs. Tocilizumab plus MTX (2 trials, N=791).

Appendix Figure H-5Network diagram for network meta-analysis: Change from baseline in radiographic joint damage score

MTX = methotrexate; N = number of patients

From: Appendix H, Supplementary Primary Network Meta-Analyses
Cover of Drug Therapy for Early Rheumatoid Arthritis: A Systematic Review Update
Drug Therapy for Early Rheumatoid Arthritis: A Systematic Review Update [Internet].
Comparative Effectiveness Review, No. 211.
Donahue KE, Gartlehner G, Schulman ER, et al.

NCBI Bookshelf. A service of the National Library of Medicine, National Institutes of Health.