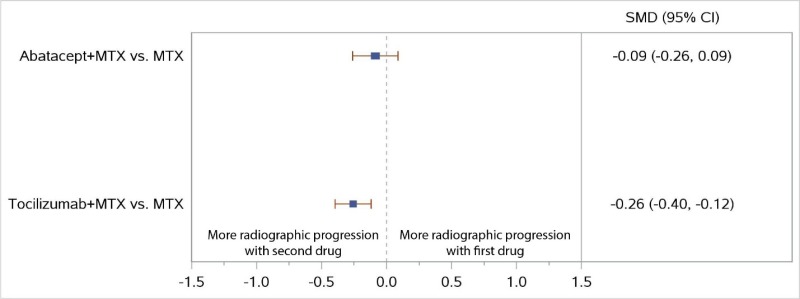
Figure 12 displays a forest plot for the network meta-analysis of studies reporting change from baseline in radiographic joint damage score. Two comparisons were used in this analysis. Study-level data used in this Figure are presented in Appendix C. This figure is described further in the KQ1 Results section “Non-TNF Biologic Plus MTX Versus Either Non-TNF Biologic or MTX”. For the combination of ABA plus MTX versus MTX monotherapy, the figure’s results were described as follows: “The combination of ABA plus MTX had numerically less radiographic progression than MTX monotherapy, but the difference was not significant (SMD, −0.09; 95% CI, −0.26 to 0.09)”. For the combination of TCZ plus MTX versus MTX monotherapy, the figure’s results were described as follows: “In the NWMA, TCZ plus MTX showed higher ACR50 response rates and less radiographic progression than MTX monotherapy (RR, 1.29; 95% CI, 1.13 to 1.47 and SMD −0.26; 95% CI, −0.40 to −0.12, respectively)”.

Figure 12Forest plot for change from baseline in radiographic joint damage score: Non-TNF biologic plus MTX versus MTX

95% CI = 95% confidence interval; MTX = methotrexate; SMD = standardized mean difference (mean difference divided by standard deviation); TNF = tumor necrosis factor; vs. = versus.

From: Results

Cover of Drug Therapy for Early Rheumatoid Arthritis: A Systematic Review Update
Drug Therapy for Early Rheumatoid Arthritis: A Systematic Review Update [Internet].
Comparative Effectiveness Review, No. 211.
Donahue KE, Gartlehner G, Schulman ER, et al.

NCBI Bookshelf. A service of the National Library of Medicine, National Institutes of Health.