Some text in this chapter has been reproduced from Mattia L, et al. Bone 2022;158:116347. This is an Open Access article distributed in accordance with the terms of the Creative Commons Attribution (CC BY 4.0) licence, which permits others to distribute, remix, adapt and build upon this work, for commercial use, provided the original work is properly cited. See: https://creativecommons.org/licenses/by/4.0/. The text, where applicable, below includes minor additions and formatting changes to the original text.
Parts of Table 11 are reproduced from Davis S., et al. Health Technol Assess 2016;20(78). This is an Open Access article distributed in accordance with the terms of the Creative Commons Attribution (CC BY 4.0) license, which permits others to distribute, remix, adapt and build upon this work, for commercial use, provided the original work is properly cited. See: https://creativecommons.org/licenses/by/4.0/. The tables include minor additions and formatting changes to the original text.
Introduction
The aims of the economic evaluation were to assess the cost-effectiveness of alternative BP regimens compared to oral ALN. The economic evaluation was based on the model developed by ScHARR to inform the NICE technology appraisal of BP (TA464).45 The key areas updated relate to the following parameters, informed from the data available from Chapter 4:
treatment efficacy
treatment persistence
adverse effects.
In addition, we have also updated the costs to reflect current prices. Updates to the model made during the NICE appraisal of non-BP to incorporate new HRQoL data and include DXA have also been retained.160 Drug and administration costs for BP treatment have also been updated. All other model inputs and assumptions not discussed below are unchanged from the model used in TA464. A summary of the key features of the model is provided in Table 11.
Methods
Brief overview the of model structure
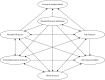
The model used a discrete event simulation (DES) framework to simulate lifetime costs and QALYs for a cohort of patients treated using each of the alternative BP treatment regimens (ALN, RIS, IBN-oral, IBN-or, ZOL). A schematic of the model structure is shown in . The key clinical events modelled are fractures at the hip, vertebrae, wrist or proximal humerus, all-cause mortality and fracture-related mortality, with the latter only possible following hip or vertebral fractures. Fractures are associated with an acute cost in the year of fracture and an ongoing cost in subsequent years. Costs in the model are estimated from a NHS and Personal Social Services (PSS) perspective, including costs incurred in primary and secondary care and social care provided in the home. In addition, hip fractures are also associated with an increased risk of new admission to a residential care home, with an associated cost for a proportion of patients whose residential care is not self-funded. Fractures are associated with a reduction in HRQoL, with separate decrements applied in the first and subsequent years after fracture, with a further decrement applied to patients admitted to a nursing home following fracture. The prevention of fractures therefore results in QALY gains through the avoidance of these HRQoL decrements, in addition to the QALY gains achieved by preventing fracture-related mortality. Future costs and benefits are discounted at 3.5% per annum.
Clinical events that can occur during a patient’s lifetime in the DES.
Patient cohort
The model is a patient-level simulation that takes into account the heterogeneous patient characteristics present within the cohort simulated. The cohort simulated all patients eligible for fracture risk assessment within CG146. It therefore includes both men and women, patients with and without a prior fracture, those with steroid-induced osteoporosis, those with secondary osteoporosis and those with other risk factors for fragility fractures. In addition, a proportion of the cohort is assumed to reside in a care home at the start of simulation. The characteristics of each individual within the population are simulated. Life expectancy, body mass index (BMI), steroid use, prior fracture and residential status (care home or community dwelling) are sampled dependent on age and sex, whereas the remaining Qfracture risk factors are sampled based on their prevalence within the Qfracture cohort. The Qfracture algorithm estimates the risk of fracture for each simulated individual. As cost-effectiveness varies with baseline risk of fracture, results were presented for fracture risk categories defined according to deciles of absolute risk. This allowed identification of the optimal strategy for patients according to their fracture risk. As the primary aim of the analysis was to compare alternative BP to ALN, the presentation of the expected value of parameter information (EVPI) analysis focused on those groups where ALN was recommended. The NICE quality standard (QS149) provides a table of treatment thresholds that vary by age, with the intervention threshold in the lowest age group being a 10-year absolute fracture risk of 5.9% (NICE 2017). Based on this, we have presented EVPI results for the 8th, 9th and 10th risk categories, as the average risk in the 8th risk category is 5.5% (range of 4.6–6.6%).
Treatment duration
The intended treatment duration was assumed to be 5 years for oral BP and 3 years for IV ZOL. This was based on the national osteoporosis guideline group (NOGG) guideline that states that ‘treatment review should be performed after 3 years of IV ZOL therapy and 5 years of oral BP’.161 Many patients do not persist with treatment for the full intended treatment period. The review and NMA of treatment persistence based on observational studies (see Chapter 4) found that patients treated with IV ZOL had a statistically significantly lower risk of stopping treatment early compared to those being treated with ALN. Those being treated with IBN-IV had a lower risk of stopping early than those treated with ALN and those treated with RIS had a higher risk, but in both cases, the difference was not statistically significantly different. The risk of stopping treatment with IBN-oral and ALN was very similar.
The duration of treatment persistence for ALN was estimated based on a study by Morley et al.162 which used routine data from the UK’s Clinical Practice Research Datalink (CPRD), which is a longitudinal database of primary care records. This study was selected as it is based on UK data and provided more up-to-date estimates than the study of CPRD data, which was used previously. The data provided by Morley et al. were pooled across all forms of oral BP, but the estimates obtained are considered to be reasonably representative of the expected treatment persistence for ALN as it comprises 89% of prescriptions for oral BP (Prescription Cost Analysis March 2021). The mean treatment persistence for ALN was calculated by estimating the area under the time-to-discontinuation Kaplan–Meier curve up to 60 months for patients taking oral BP. The estimates presented by Morley et al. for patients not previously treated for osteoporosis were considered most appropriate for informing the choice of BP as BP are generally the first treatment offered. We reconstructed the synthetic patient-level data from the Kaplan–Meier data presented by Morley et al. using the methods described by Guyot et al.163 These were used to estimate a restricted mean survival (assuming no one is treated beyond 60 months) of 1.92 years (95% CI 1.89 to 1.94). For RIS and IBN-oral, the HRs for treatment persistence relative to ALN from the NMA of observational studies were applied to the Kaplan–Meier curve for ALN to estimate equivalent Kaplan–Meier curves for the other two oral BPs. The areas under these curves were then calculated to provide an estimate of mean treatment persistence when incorporating the uncertainty in the risk ratios (RRs) for treatment persistence. The estimates of mean treatment persistence were 1.81 (95% CI 1.68 to 1.94) and 1.91 (95% CI 1.66 to 2.14) for RIS and IBN-oral, respectively.
For IV ZOL, the CPRD was not considered to be a suitable source of data as Morley et al. state that treatments such as IV ZOL, which are primarily administered in secondary care, may be inadequately captured in the CPRD. No UK source of data on treatment persistence for IV ZOL in secondary care was identified in the review of adherence studies. However, a Swedish study by Spångeus et al.164 reporting persistence for IV ZOL up to 3 years was identified during the review process (it was not included in the review as it did not compare adherence across two or more treatments). The Swedish system is similar to the UK system in that it is a tax-financed system in which patients do not pay for treatment at the time of need, and it is likely to be more reflective of persistence in the UK NHS than estimates obtained from insurance-based healthcare systems. An average duration of treatment persistence for IV ZOL of 2.59 years (95% CI 2.51 to 2.66) was estimated from the Swedish study. The CI was estimated by using beta-distributions to sample the proportion discontinuing at 1 and 2 years.
No suitable estimate of treatment duration was identified for IBN-IV from the adherence review, Chapter 4. Therefore, the HR for treatment discontinuation for IBN-IV relative to ZOL from the review and NMA of observational studies, Chapter 4, was applied to estimate the expected proportion of patients who would be persisting on treatment at 1, 2 and 3 years for IBN-IV, and a linear reduction between these points was assumed. The mean treatment duration based on the area under the curve was estimated to be 2.30 years (95% CI 2.06 to 2.55), where the CI incorporates the uncertainty in the HR for treatment discontinuation for IBN-IV compared to IV ZOL.
Treatment costs
Drug costs for oral BP were estimated using the NHS Drug Tariff165 NHS Business Services Authority 2021. Where multiple preparations are available, it is assumed that the lowest cost preparation will be prescribed. For IV BP, which is administered in secondary care, drug costs were based on the electronic market information tool (eMIT) database of generic drug costs in secondary care (eMIT 2021). For IV ZOL, the cost of the 5 mg/100 ml preparation licensed for use in osteoporosis is significantly higher now than it was in previous years (£67.84 in 2021 vs. £13.24 in 2018). This price increase is believed to be due to temporary supply issues for the generic formulation, and it was noted by clinical experts that it has become routine clinical practice in some areas to make up the 5 mg dose using two 4 mg vials, which are marketed for another indication and which have a significantly lower price (£3.54 per 4 mg). We applied the price for the 5 mg preparation in our base-case analysis and have explored the impact of assuming that two 4 mg vials are used to make up the 5 mg dose in a scenario analysis.
Administration costs were assumed to be zero for oral BP. Administration of IV BP was assumed to occur as a day-case procedure for both ZOL and IBN-IV. As no suitable NHS reference cost could be identified for day-case administration of IV BP, the approach used in TA464 was to assume that the costs for the day-case procedure would be similar to the administration of simple parenteral chemotherapy (SB12Z). This assumption has been maintained in the current analysis. Administration costs, which are based on 2019/2020 NHS reference costs, are summarised in Table 12. We have assumed that patients would receive a DXA scan on completion of treatment (3 years for IV BP and 5 years for oral BP) as part of the assessment of whether treatment should be continued. This is in keeping with the recommendation in the NOGG guideline and the approach taken when the model was updated for the appraisal of non-BP. The cost of DXA was applied in the model by including the annualised cost of DXA within the drug cost, such that lower DXA costs are incurred when patients are assumed to stop treatment early. The cost for DXA was based on the NHS reference cost for direct access DXA (£84.59 for RD50Z). The monitoring costs, based on 2019/2020 NHS reference costs, are summarised in Table 11.

Summary of treatment-specific model inputs
Treatment offset
For all BP, it was assumed in the model that the treatment effect persists for some time after treatment is stopped, as the effect of the treatment on BMD does not reverse immediately at the point that treatment is discontinued. The time taken for the treatment effect to reduce to zero is described as the offset period in the model. In keeping with the assumptions made in previous cost-effectiveness analyses, we assumed that the offset period for ALN was equivalent to the treatment duration. This was based on evidence that it took 5 years for hip BMD to return to pre-treatment levels when treatment with ALN was discontinued after 5 years in the FLEX study.166,167
For RIS, two studies reported findings that gains in hip BMD were lost in the year following treatment discontinuation.160,168 For IBN-oral data were limited, but one study which used a daily dose of IBN found that hip BMD returned to pre-treatment levels 1 year after completing 1 year of treatment.169 Based on this, we have assumed that RIS and IBN-oral have a 1-year offset period in the base-case analysis but have explored an offset period equal to treatment duration in a sensitivity analysis. IV ZOL is thought to have a longer offset period than ALN, as femoral neck BMD was found not to have returned to baseline after 3 years of IV ZOL, followed by 3 years of PLB in the HORIZON-PFT extension study.168 Based on this, we have applied the assumption used in previous models, which is that 3 years of treatment with IV ZOL is expected to provide up to 10 years of effect. We have therefore assumed in the base-case analysis that the offset period for IV ZOL is 2.3 times the treatment duration [i.e. (10 − 3)/3 = 2.3]. We have explored setting the offset period equal to treatment duration for IV ZOL in a sensitivity analysis. For IBN-IV, we have made the same assumption as previous models,170 which have assumed that the offset time for IBN-IV is equivalent to that for IBN-oral as there is a lack of studies reporting treatment efficacy following discontinuation for IBN-IV.
Treatment efficacy
The model uses the patient’s characteristics to estimate their risk of fracture when receiving no antifracture medication based on the Qfracture algorithm. The risks of fracture for patients on each treatment pathway were estimated by adjusting the fracture risks estimated by the Qfracture algorithm to take into account the efficacy of treatment. The model applied the HRs for fracture estimated from the updated review and NMA described in Chapter 4. The same efficacy estimates have been applied to both men and women, as a previous network analysis found that there was no evidence of differential treatment effect by sex. These HRs were applied for the duration of treatment persistence. Treatment efficacy was assumed to wane linearly over the offset period such that no further treatment effect is assumed beyond the end of the offset period.
For hip, vertebral and wrist fractures, the HRs from the relevant NMA were applied, but for proximal humerus fractures, data from the non-vertebral fracture NMA were applied. No data were included in the networks for IBN-IV. We assumed that the treatment efficacy of IBN-IV was equivalent to that of IBN-oral. This was based on the fact that both the 150 mg monthly oral dose and the quarterly 3 mg IV dose were licensed on the basis that they were non-inferior to the 2.5 mg daily dose on BMD outcomes.171–173
Adverse effects
The review of RCTs described in Chapter 4 identified that arthralgia, headache, myalgia, pyrexia and influenza-like symptoms were all statistically significantly more common for patients having IV ZOL than for patients having PLB. No other BP treatment was found to have a statistically significant higher risk of these adverse effects when compared to PLB, although no data were available for IBN-IV. The cluster of symptoms associated with IV ZOL appears to occur within the same time period (within 3 days of infusion) and is sometimes referred to as an ‘acute-phase reaction’.174 They are also more common at the time of the first infusion. We have therefore assumed that they occur together as a cluster of symptoms and have used the data reported for influenza-like symptoms to estimate the risk of patients experiencing an acute-phase reaction, which could include arthralgia, headache, myalgia, pyrexia or other influenza-like symptoms. The NMA for influenza-like symptoms was used to estimate the absolute difference in these symptoms between patients treated with IV ZOL and those treated with PLB. This gave an increased risk of influenza-like symptoms of 6.8% (95% CI 3.3% to 12.7%) attributable to treatment with IV ZOL. An identical risk was applied to IBN-IV as there were no comparative data and it was assumed that the acute-phase reaction would be similar for other IV BP. Symptoms were assumed to last 3 days and occur only on the first dose (HRQoL data applied during this period are discussed below). For patients experiencing flu-like symptoms following administration of IV BP, a QALY loss of 0.005 was applied based on the approach used in TA464 in which a utility multiplier of 0.35 was applied for a period of 3 days. This was based on a study reporting a utility value of 0.34 in patients with flu-like symptoms relative to a baseline value of 0.97 prior to flu-like symptoms.175
The model developed to inform TA464 included a risk of 3% for GI adverse effects for oral BP based on a review of observational studies by Lloyd et al.45 In that analysis, the risk of experiencing a GI adverse effect was estimated from a study reporting adverse effects for ALN, and it was assumed that an equal event rate would apply to all three oral BPs. However, in this analysis, we are interested in capturing any uncertainty regarding the difference in side effects between the different oral BPs. Therefore, in this analysis, we have applied the RRs versus ALB obtained from the NMA, to the absolute risk of 3%, to estimate the risk of GI adverse effects for RIS and IBN-oral. This gave risks of 3% (95% CI 2% to 5%) and 4% (95% CI 2% to 8%), respectively, for RIS and IBN-oral. We did not include any GI adverse effects for IV BP, as although they are reported, they were considered to be part of the ‘acute-phase reaction’, which has already been incorporated within the risk of influenza-like symptoms. For patients experiencing GI adverse effects, we have applied a QALY loss of 0.0075 and a cost of £39 for a GP appointment176 at the start of treatment.
Disease costs
NHS resource following fracture in TA464 was based on two UK resource use studies which reported costs for hip and non-hip fractures and included activity in both primary care and secondary care.177,178 These were combined with NHS reference costs to estimate NHS costs in the year following fracture and in subsequent years for each fracture type (hip, vertebral, wrist and proximal humerus). These fracture costs were retained in the current analysis, but they were uplifted to reflect current prices using PSSRU inflation indices.177 Similarly, costs for home help and residential/nursing home admission incorporated in the model for TA464 were retained but were similarly uplifted to reflect current prices. Costs following fracture are summarised in Table 13.
Costs and utility values applied following fracture or new admission to residential care
Health-related quality of life
In the model developed to inform TA464, the impact of treatment on HRQoL was incorporated through the impact of treatment on fragility fractures and adverse events. Although HRQoL was included as an outcome in the safety and efficacy review, it was only reported in two studies, and neither of these reported using a preference-based measure of HRQoL that would be suitable for incorporation in the economic model. Therefore, there was insufficient evidence to incorporate a difference in HRQoL measured directly between BP regimens, and the previous approach to model HRQoL through its impact on fragility fractures and adverse events was maintained.
The main source of utility data in the model for TA464 was the Swedish KOFOR study,179 which was later expanded into the ICUROS international study.180 At the time the model was developed for TA464, only short-term data (4 months post fracture) were available from the ICUROS study, so the KOFOR study, which had longer follow-up (12 months), was preferred. However, an updated review of the impact of fragility fractures on HRQoL was conducted during the NICE appraisal of non-BP.171 In that review, a set of more recent publications were identified describing longer-term utility values from the ICUROS study.180,181 Based on that review, the model had been updated to include these more recent estimates. These publications provide a source of utility values that is based on the EQ-5D, using a UK time trade-off valuation set, which is NICE’s preferred method for estimating utility values.182 They provide estimates of utility pre-fracture (based on recall shortly after fracture) and at 4, 12 and 18 months post fracture, allowing an average utility value to be estimated in both the year of fracture and in subsequent years. Utility values were provided for all four fracture sites, providing consistency in the methods used, although only three out of the four fracture sites (hip, wrist and vertebral) were reported from the whole international cohort.181 Therefore, the estimate for proximal humerus fracture was taken from the Australian arm of the ICUROS study.182 These updated utility estimates were retained for the current analysis. The utility value for patients admitted to residential care following fracture previously applied in TA464 was also retained. Utility values applied following fracture or nursing home admission (see Table 13).
Approach to sensitivity analysis
A probabilistic sensitivity analysis (PSA) was conducted to estimate the mean costs and QALYs gained when taking into account the uncertainty in the parameter values used in the model. The sampling of parameters was consistent with the methods previously reported by Davis et al.45 The exceptions were the parameters capturing efficacy, treatment persistence and adverse events, which have all been updated in this analysis. For the estimates of treatment efficacy, we used the convergence diagnosis and output analysis (CODA) samples from the NMA described in Chapter 4. We assumed that the mean treatment persistence for ALN was normally distributed using the 95% CI calculated from the Kaplan–Meier data from Guyot et al.163 We used beta distributions to sample the proportion discontinuing IV ZOL at 1 and 2 years165 and generated sampled estimates of mean treatment persistence for IV ZOL. For the remaining oral and IV treatments, we applied the CODA samples from the HRs for treatment persistence relative to the baseline treatment persistence curves for ALN and IV ZOL, respectively. For the adverse effects of GI symptoms on oral BP, we applied the CODA samples for the relative risk of GI symptoms in patients having RIS and IBN-oral compared to ALN. This was applied to a fixed risk of 3% for ALN. For the adverse effect of flu-like symptoms in patients having IV ZOL, we used the CODA samples from the NMA described in Chapter 4 to estimate the absolute risk of flu-like symptoms for IV ZOL and applied this identically to both IV BP.
For the base-case cost-effectiveness estimates, we ran the model for 2 million patients with a single set of parameter samples per patient. As cost-effectiveness is dependent on absolute fracture risk, results were presented by risk category, with each category representing a decile of absolute fracture risk and therefore informed by approximately 200,000 patients.
Structural sensitivity analyses were conducted to explore whether the results were sensitive to different model assumptions. To reduce model computation time, the structural sensitivity analyses were conducted using mid-point parameter inputs rather than using the full PSA version of the model.
Value of information analysis
Expected value of parameter information provides an estimate of how much more net monetary benefit could be achieved if every parameter informing the model was known precisely, and this allowed the decision-maker to refine their choice of treatment accordingly. The value of knowing every model parameter precisely is known as the overall EVPI. In addition, partial EVPI can be estimated for single parameters or groups of parameters, and this can tell the decision-maker how much more net benefit could be achieved if perfect information was known just about those particular parameters.183 EVPI is useful in determining which model parameters are associated with the greatest decision uncertainty and would therefore be priorities for further research. It should be noted that EVPI does not address whether a particular study to obtain further research data would be worthwhile, as this would also depend on the ease of obtaining further data and how much this is likely to reduce the current uncertainty.
The EVPI was estimated for the higher risk categories (8–10), where there is overlap between the risk level in those categories and the risk levels at which patients qualify for treatment according to the treatment thresholds in the NICE clinical standard. The no-treatment option was excluded for the EVPI calculation as we are interested in which parameters drive decision uncertainty regarding whether alternative BP should be used instead of ALN.
In addition to estimating the overall EVPI, partial EVPI was estimated for parameters that are specific to the individual BP: treatment persistence, adverse event rates and HRs for fracture risk reduction. The EVPI was calculated by running a cohort of 50,000 patients repeatedly for 1000 different sets of parameter inputs. Then the SAVI tool was used to estimate the partial EVPI using non-parametric regression for groups of parameters184
Results
Base-case results
The adverse clinical outcomes avoided for each BP treatment compared to no treatment are summarised in Table 14. These are based on average outputs from the probabilistic model (run for a cohort of 2 million patients, resampling parameter inputs for each patient). It can be seen that the fractures avoided by IV ZOL treatment are higher than for the other BP treatments. This is largely driven by the longer duration of treatment persistence and the longer offset period. Of the remaining treatments, ALN prevents the most hip and vertebral fractures, which translates into fewer fatal fractures and fewer new admissions to nursing/residential care. Although IBN-IV prevents slightly more fractures overall than ALN, this is driven by it preventing more wrist fractures, which have a smaller impact on costs and utilities than hip and vertebral fractures.
Clinical outcomes across the whole population eligible for fracture risk assessment
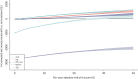
The base-case cost-effectiveness results from the probabilistic model are summarised in Table 15, which shows the incremental cost-effectiveness ratio (ICER) for each treatment relative to no treatment within each risk category. It can be seen that ALN has an ICER under £20,000 per QALY relative to no treatment from the sixth risk category, RIS from the eighth risk category and IBN-oral from the ninth risk category (10-year average risks of 2.7%, 5.5% and 8.4%, respectively). Table 16 shows the ICERs for each of the alternative BP relative to ALN. It can be seen that all of the alternative BPs, except IV ZOL, are dominated by ALN in that they have a higher cost and lower QALY gain. The ICERs for IV ZOL compared to ALN are greater than £30,000 per QALY across all risk categories. While ICERs are useful when determining which treatment is cost-effective compared to no treatment, it can be more helpful to use incremental net monetary benefit (INMB) to determine the most cost-effective intervention. Treatments which are cost-effective compared to no treatment have an INMB relative to no treatment that is greater than zero, and the optimal treatment has the highest INMB. shows the variation in INMB (when valuing a QALY at £20,000) with absolute risk. Results for risk levels above 40% were not plotted, as the estimates are unstable at high levels as they are based on very small numbers of patients.
Incremental cost-effectiveness ratios vs. NT and treatment with maximum NMB by risk category for Qfracture
Incremental cost-effectiveness ratios vs. ALN by risk category for Qfracture
Incremental net monetary benefit for BP compared to usual care plotted against absolute risk.
From it can be seen that each of the BP, with the exception of IBN-IV, achieves an ICER under £20,000, relative to no treatment, once a certain level of absolute risk is reached because their INMB becomes positive. The risk levels required for the BP to achieve an ICER under £20,000 compared to no treatment are 1.9%, 4.0%, 6.7% and 26.9% for ALN, RIS, IBN-oral and IV ZOL. However, even at higher levels of absolute risk, ALN is the most cost-effective intervention, as it has the highest INMB. also shows the CIs around the estimates of INMB. These widen at higher levels of absolute risk, but there is no crossing of the CIs until the risk is above 30%. The CIs for INMB for ALN and RIS do overlap at higher levels of absolute risk, and they overlap substantially when the risk reaches 40%. This suggests there may be some uncertainty regarding the most cost-effective treatment, but only at very high levels of absolute risk.
Scenario analysis results
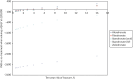
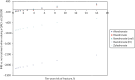
A scenario analysis was conducted to explore the impact of assuming that all treatments have an offset time equal to treatment duration, which is consistent with what was assumed for ALN. This scenario analysis was run using a cohort of 2 million patients but with parameters fixed at their mid-point values. shows the base-case results when running the model in this manner, and shows the scenario analysis assuming an offset time equal to treatment duration for all drugs. It can be seen by comparing and that this had the impact of bringing the INMBs estimates for RIS and IBN-oral closer to those for ALN. Therefore, both RIS and IBN-oral have an ICER under £20,000 compared to no treatment in the 7th risk category in this scenario. It also reduced the INMBs for IV ZOL and increased the INMBs for IBN-IV. However, the overall conclusion that the INMB was highest for ALN across all 10 risk categories was unchanged.
Incremental net monetary benefit compared to usual care for 10 risk categories when using mid-point parameter inputs – base case.
Incremental net monetary benefit compared to usual care for 10 risk categories when using mid-point parameter inputs – assuming offset equal to treatment duration.
A scenario analysis was conducted exploring the impact of assuming that clinicians use two 4 mg vials to make up the 5 mg dose of IV ZOL. This reduced the risk level at which IV ZOL achieved an ICER under £20,000 versus usual care from 26.9% to 19.9%. However, it did not alter the conclusion that ALN was more cost-effective than IV ZOL at all levels of absolute risk. A scenario analysis was also conducted to explore increasing the annual cost of prescribing oral BP to reflect prescribing time and dispensing fees for monthly prescriptions in addition to drug costs. A cost analysis exploring the differences in costs between monthly and quarterly prescribing of repeat prescriptions from a UK NHS perspective assumed that GPs take just under a minute (49 seconds) to process a repeat prescription.184 Applying the unit cost per hour of GP activity (£156 per hour) and the cost of pharmacy dispensing fees (£1.29 per item) would result in an additional cost of £40.96 per annum for oral BP or £78.64 across the average duration of treatment persistence. Under these assumptions, IV ZOL would still not be the optimal treatment, even at higher levels of absolute risk. However, the risk level at which ALN would achieve an ICER under £20,000 compared to no treatment would increase to 5.0%. This would have no impact on current recommendations as the lowest intervention threshold, according to the NICE Quality Standard, is a 10-year absolute fracture risk of 5.9%.
Expected value of parameter information results
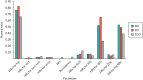
shows the partial EVPI indexed to overall EVPI for risk categories 8–10 for various groups of parameters. It can be seen that the HRs for hip fracture account for a high proportion of the overall EVPI, and this is fairly consistent across risk categories 8–10 (denoted D8–D10 on the plot). It can also be seen that the HRs for any type of fracture for IBN-oral are also quite important and that both of these are being driven by a high EVPI for the HR of hip fracture in IBN-oral as a single parameter. The decision uncertainty associated with adverse events and treatment persistence is minimal in comparison. This is because there is a great degree of uncertainty around the HR for hip fracture for IBN-oral. Consequently, the probability that IBN-oral is the most cost-effective BP is 22%, 21% and 10% in risk categories 8, 9 and 10, respectively (when valuing a QALY at £20,000), whereas the probability that RIS is the most cost-effective BP is less than 5% in each of these risk categories, and the probability that either of the IV BP is the most cost-effective BP is < 0.1%.
Expected value of perfect information for groups of parameters in risk categories 8–10 indexed to total EVPI.
Discussion
The previous economic evaluations conducted to inform the NICE appraisal of BP made several simplifying assumptions that limited the accuracy of the comparisons between the different BP treatments. For example, long-term persistence with treatment and the incidence of adverse events were assumed to be the same for all oral BPs. The key strength of this analysis is that it has taken the model used previously to inform the NICE appraisal of BP and has incorporated updated systematic reviews to better quantify the relative advantages of alternative BP regimens in terms of treatment persistence and adverse effects. It has also included an EVPI analysis to identify the key areas of decision uncertainty when selecting the optimum BP treatment regimen.
The economic evaluation has identified that when selecting the most cost-effective BP in those with a risk level sufficient to be currently eligible to receive ALN, the most important area of decision uncertainty relates to the relative efficacy of IBN-oral compared to ALN in preventing hip fractures. This is due to the wide CI for the RR of hip fracture for IBN-oral relative to PLB, which is based on a single RCT. This factor is more important than uncertainty surrounding adverse effects or treatment persistence. The higher administration costs for IV BP mean that there is minimal uncertainty relating to whether IV BP is more cost-effective. This is despite the fact that IV ZOL is predicted to result in fewer fractures than ALN due to its higher treatment persistence and a longer offset period. Whether alternatives to hospital administration, such as IV ZOL delivered in a home care setting, are more cost-effective requires further evaluation.
Strengths and limitations
Limitations of this analysis include the minimal comparative data available for IBN-IV, which meant that it was necessary to assume that IBN-IV had efficacy similar to IBN-oral and adverse events similar to ZOL. Therefore, the results for IBN-IV should be treated with caution. In the NMA conducted to inform the NICE appraisal of BP, studies that reported outcomes for the daily 2.5 mg IBN-oral were included in the analysis, despite the fact that this was not a licensed dose of IBN-oral. However, in the previous analysis, efficacy estimates from this unlicensed dose were applied in the economic model for the licensed doses of IBN-oral (i.e. 150 mg monthly IBN-oral and the quarterly 3 mg IBN-IV), where data specifically from these licensed doses were lacking in the NMA. The approach taken in our review and economic evaluation was to limit the data to trials reporting outcomes for licensed doses of IBN, which better reflects the evidence gap for IBN-oral and IBN-IV. This is preferable given that one of the aims of this project was to identify where further research to reduce uncertainties in the current evidence base would be useful. Finally, our analysis was conducted from a UK NHS and PSS perspective, and the conclusions are not expected to apply to other countries or healthcare settings.