

NCBI Bookshelf. A service of the National Library of Medicine, National Institutes of Health.
SNP FAQ Archive [Internet]. Bethesda (MD): National Center for Biotechnology Information (US); 2005-.
This publication is provided for historical reference only and the information may be out of date.

The Graphical View
What do the different colors in the SNP histogram represent?
The SNP Table View
What SNP viewing options does GST have?
There are two ways to view SNPs :
- 1.
Graphical View
The graphical view of Gbench with its incorporated GST, now shows all the features in a given range of sequence — including SNPs.- 2.
Table Views
Once you select an object, or range in the graphical view, you can create a SNP Table view of the selected information.Please note: This FAQ answer assumes a working knowledge of Genome Workbench. To learn how to use Genome Workbench, go to thetutorialpage of the Genome Workbench site. (04/23/08)
The Graphical View
Where will I find SNPs in the Graphical View?
When the graphical view is zoomed out and showing a large range of sequence, you will see a histogram of annotated variations in the sequence range you are viewing near the top of the graphical view window You will initially see “+” signs in the histogram, but as you zoom in more closely into a smaller sequence range, the histogram will resolve itself into more and more specific SNP information — from individual SNPs down to allelic information when you’ve zoomed in as far as seeing individual sequence.
Please note: This FAQ answer assumes a working knowledge of Genome Workbench. To learn how to use Genome Workbench, go to thetutorialpage of the Genome Workbench site. (04/23/08)
When I’m looking at a large range of sequence using Graphical View, I notice the SNP histogram at the top of the page shows “+” and “1”. What do these mean?
The “1” in the SNP histogram indicates that there is a single SNP in the range of sequence represented by that box within the SNP histogram.
The “+” in the SNP histogram indicates that there are more than 10 SNPs in the range of sequence represented by that box or “bin” within the SNP histogram. As you zoom in more closely, the “+” will eventually resolve itself into a single digit statement of the number of SNPs in the sequence represented by that particular SNP histogram “bin”. As you zoom closer and closer to sequence level, the bins will resolve into single SNPs, and finally into the allelic information for a single SNP.
Please note: This FAQ answer assumes a working knowledge of Genome Workbench. To learn how to use Genome Workbench, go to thetutorialpage of the Genome Workbench site. (04/23/08)
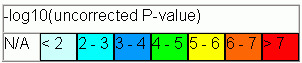
What do the different colors in the SNP histogram represent?
The colors represent the uncorrected p-value range for the SNPs located in a single box or “bin” of the histogram.
(04/23/08)
If there are 9 SNPs in a SNP histogram box (bin), is there any way to access the ID of the most significant SNP in the group without having to zoom all the way down to sequence level?
Yes, you can, but you must first zoom down to the sequence level where the major tick marks indicating the sequence coordinates are at 500bp intervals. Once you have zoomed down to this point:
Move your cursor to the bin of interest, and allow it to remain there several seconds; a pop-up box will appear that will give you the –log10 p-value, the SNP count, and the rs number of the most significant SNP in the bin.
Click the bin of interest to release a menu. Select “Open RS in Web Browser”; this will access the refSNP cluster report for the most significant SNP in the bin.(04/23/08)
If I zoom all the way down to sequence level, what kind of information will I get besides the SNPs’ alleles?
If you zoom all the way down to sequence level, you will see the following information located just below the sequence data:
The alleles for each of the SNPs located in the section of sequence you are viewing will be shown just below the sequence in a small colored box lined up in correct relative position.
Just below the listing for all the known variations in the sequence, you will see members of this category of variations, again represented by their alleles in colored boxes that are lined up in correct relative position.
Just below the listings for Uniquely Placed Variations, you will see members of this category of variations, again represented by their alleles in colored boxes that are lined up in correct relative position.
Can be found if you place your cursor on that colored box and leave it for a couple of seconds, a box will pop up giving you the rs number for the variation; its alleles; the total length of the variation; the exact position of the variation; and the variation’s strand orientation. (04/23/08)
How do I filter SNPs in the Graphical View?
- 1.
Select an object or a range to apply a filter.
- 2.
Right-click on the object to bring up the context menu.
- 3.
Select “SNP Filters”.
- 4.
Select “Create Track”. The “Create Track” dialog box will let you create a filtered SNP track based on filters you define.(04/23/08)
The SNP Table View
How do I access SNP Table View for particular data?
There are three ways that you can access the SNP table View:
Access Method #1:
- a.
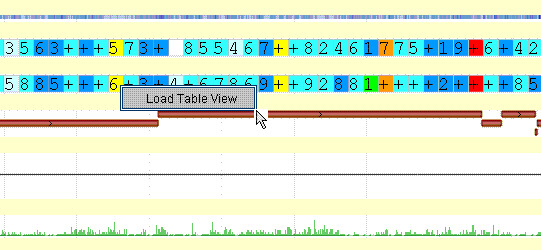
While you are in the Graphical View, click on any colored “bin”.
- b.
A pop-up menu will appear with a single selection: “Load Table View”.
- c.
Click on the words “Load Table View” to see a SNP Table View of the SNPs in the region represented by the selected “bin”:
Access Method #2:
- a.
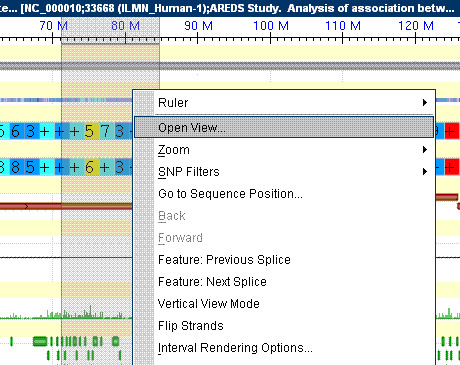
In Graphical View, select an object or range you would like to see as a SNP Table View by clicking and dragging on the ruler located at the top of the graphical view pane.
- b.
Right-click. A pop-up menu will appear.
- c.
Select “Open View”:
Access Method #3:
- a.
Select an object or range in the graphical view.
- b.
Click on “View”, located in the tool bar at the top of the Gbench page to release a drop-down menu.
- c.
Select “New View” to release another drop-down menu.
- d.
Select “Sequence” to release another drop-down menu.
- e.
Select “SNP View” to bring up the SNP Table View
(05/22/08)
What will I see in the SNP Table View?
The SNP Table View allows you to see information found in a SNP’s encoded bitfield. The columns in the table are set as defaults and do not include all of the information available in the bitfield. (See other FAQs in this section for adding to the information in the SNP Table View). Below are the column heads for the default SNP Table View; each column will include data for a specific SNP if that data is available.
If you cannot see all of the data in a particular column, place your cursor on the column divider, and click and drag to resize the column.
Clicking on entries in this column will take you to the refSNP Cluster Report for that rsID number.
Clicking on entries in this column will take you to the SNP3D page for that that rsID number.
Clicking on entries in this column will take you to Population Diversity section of the RefSNP Cluster Report for that that rsID number, showing the genotype detail)
Clicking on entries in this column will take you to the SNP3D page for that that rsID number.
Clicking on entries in this column will take you to a variation report for those SNPs that were submitted as a disease-related mutation and/or are present in a locus-specific database (the links for this column may not yet be functional)(04/23/08)
I have the SNP Table View open, but I cannot see all the data in the columns. How do I increase the column size?
If you cannot see all of the data in a particular column, place your cursor on the column divider, then click and drag to resize the column.
(04/23/08)
Is there a way to get information in SNP Table View in addition to that already in the SNP Table View columns?
The columns in the SNP Table View are set as defaults and allow you to see only a portion of the available information found in a SNP’s encoded bitfield; you can either remove or add to the columns If you ‘right-click’ the column headers:
- 1.
Right click on any column header to release a mini menu.
- 2.
Select “Adjust Columns”
- 3.
In the resulting “Choose Column Details” dialog box, click on the default column selection check marks to remove them, or click on an new selection to add it (check mark will appear).
- 4.
Click “OK”
(04/23/08)
How do I filter SNP data in the SNP Table View?
- 1.
Right click on an empty area of the SNP Table View (a white portion of the SNP Table View pane rather than on an empty portion of the table itself) to release a mini-menu (you can also access this menu by Selecting “View” from the toolbar at the top of the Gbench page to release a drop-down menu; then select “SNP View”).
- 2.
Select “Apply Filter”
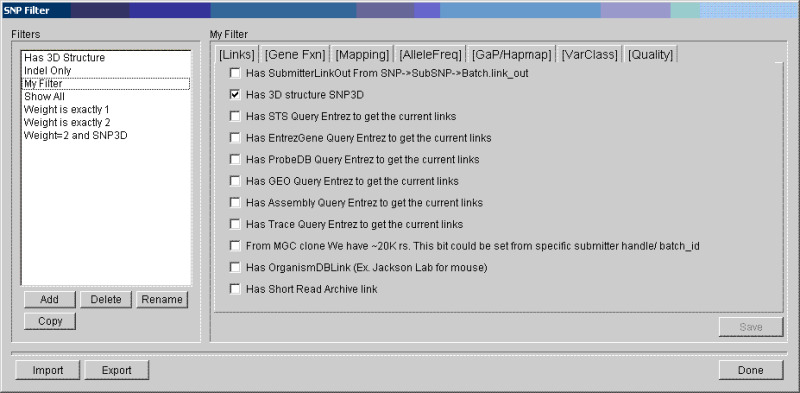
- 3.
Use the resulting “SNP Filter”dialog box to select and edit the filter you wish to apply:
The currently supported features for filtering are those found in SNP Bitfield v3.
(05/22/08)
- Using Specific GST Features - SNP FAQ ArchiveUsing Specific GST Features - SNP FAQ Archive
Your browsing activity is empty.
Activity recording is turned off.
See more...