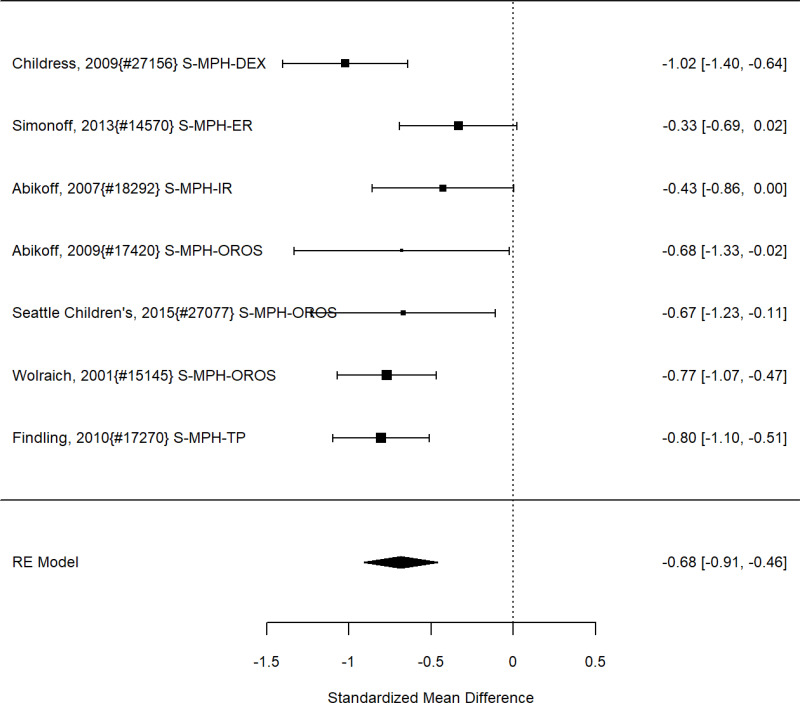
Figure 50. Subgroup analysis: Methylphenidate versus control on ADHD symptoms (SMD)
The figure is a forest plot that displays all studies that reported on the effects of subgroup analysis of methylphenidate vs control on ADHD symptoms using the standardized mean difference (SMD). The figure also shows the pooled result across studies.

Figure 50Subgroup analysis: Methylphenidate versus control on ADHD symptoms (SMD)

Notes: ADHD = attention deficit hyperactivity disorder, S-MPH-DEX = dexmethylphenidate, S-MPH-ER = extended release methylphenidate, S-MPH-IR = immediate release methylphenidate, S-MPH-OROS = osmotic-release methylphenidate, S-MPH-TP = transdermal patch methylphenidate, RE = random effects, SMD = Standardized Mean Difference

From: 5, Results: Treatment of ADHD
Cover of ADHD Diagnosis and Treatment in Children and Adolescents
ADHD Diagnosis and Treatment in Children and Adolescents [Internet].
Comparative Effectiveness Review, No. 267.
Peterson BS, Trampush J, Maglione M, et al.

NCBI Bookshelf. A service of the National Library of Medicine, National Institutes of Health.