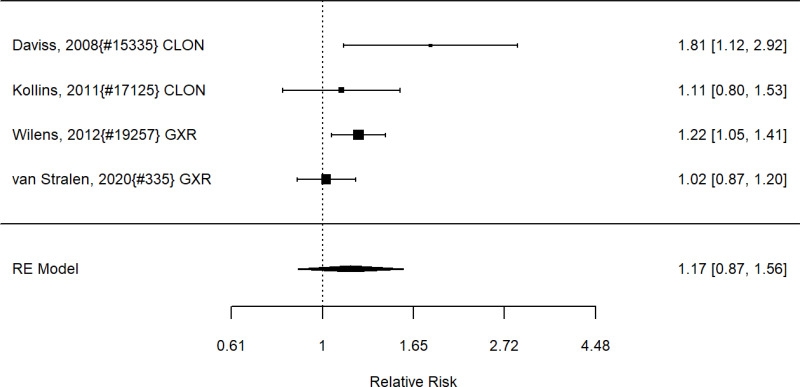
Figure 33. Subgroup analysis: Non-stimulants (all alpha agonist) plus stimulants vs stimulants alone on participants with adverse events (RR)
The figure is a forest plot that displays all studies that reported on comparing non-stimulants vs stimulants alone on participants with adverse events using relative risk for subgroup analysis. The figure also shows the pooled result across studies.

Figure 33Subgroup analysis: Non-stimulants (all alpha agonist) plus stimulants versus stimulants alone on participants with adverse events (RR)

Notes: ADHD = attention deficit hyperactivity disorder, CLON = clonidine, GXR = guanfacine, RE = random effects, RR = relative risk

From: 5, Results: Treatment of ADHD
Cover of ADHD Diagnosis and Treatment in Children and Adolescents
ADHD Diagnosis and Treatment in Children and Adolescents [Internet].
Comparative Effectiveness Review, No. 267.
Peterson BS, Trampush J, Maglione M, et al.

NCBI Bookshelf. A service of the National Library of Medicine, National Institutes of Health.