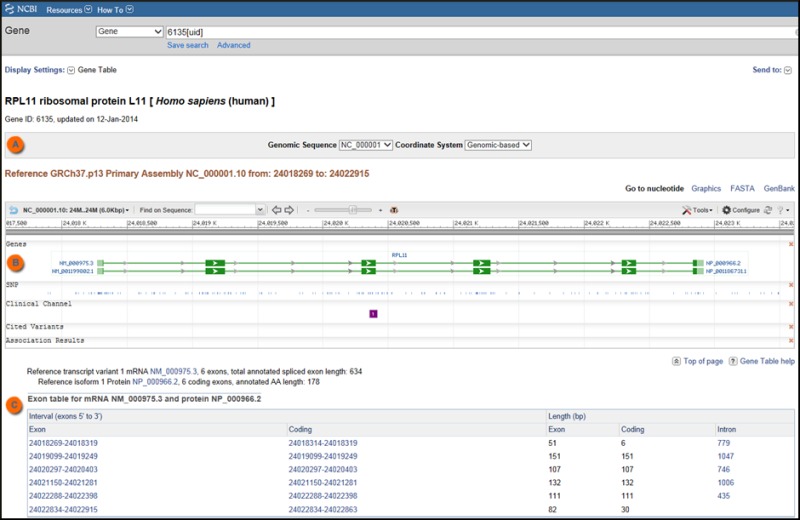
Figure 3. . Gene Table display.

Figure 3.

Gene Table display. Use the Genomic Sequence and Coordinate System options in section A to select the sequence and the numbering system you want to use to generate your report. The embedded graphic (B) allows you to see what other elements are in the range of the gene and either navigate within the page or in the full nucleotide graphics display. The table section (C) will be repeated for each transcript variant annotated on the selected sequence (not shown here for NM_001199802.1).

From: Gene Help: Integrated Access to Genes of Genomes in the Reference Sequence Collection

Cover of Gene Help
Gene Help [Internet].

NCBI Bookshelf. A service of the National Library of Medicine, National Institutes of Health.