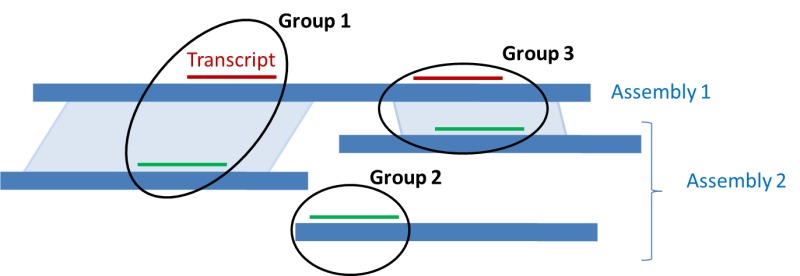
Figure 8. . Ranking of alignments across multiple assemblies.

Figure 8.

Ranking of alignments across multiple assemblies. Alignments of a given transcript are represented in red to Assemby 1 and in green to Assembly 2. If a genomic alignment exists between two regions harboring a transcript alignment (light blue parallelograms), the alignments in the paired regions are placed in the same group (Group 1 and Group 3). All alignments in a given group are given the same rank, different from the rank of other groups, based on the quality of the alignments.

From: Eukaryotic Genome Annotation Pipeline

Cover of The NCBI Handbook
The NCBI Handbook [Internet]. 2nd edition.

NCBI Bookshelf. A service of the National Library of Medicine, National Institutes of Health.