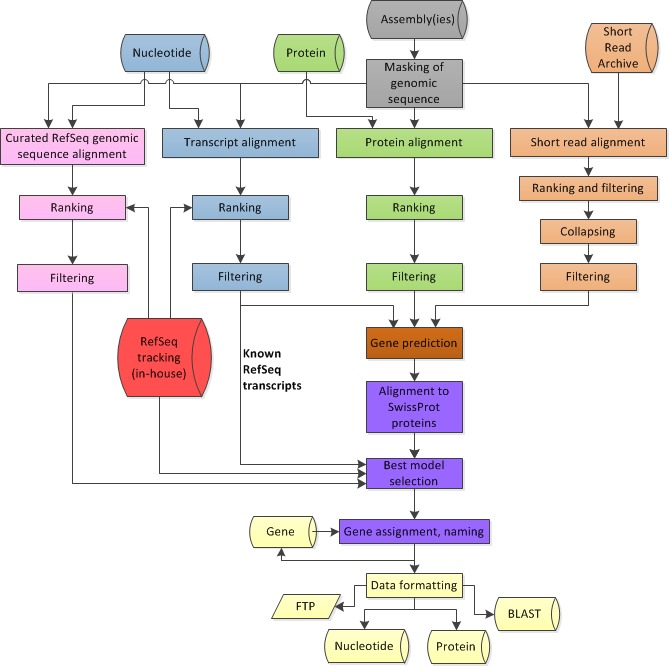
Figure 4. . Overview of the process flow in the Eukaryotic Genome Annotation Pipeline.

Figure 4.

Overview of the process flow in the Eukaryotic Genome Annotation Pipeline. In grey: genomic sequence preparation; in blue: alignments of transcripts; in green: alignment of proteins; in orange: alignment of short reads; in pink: alignment of curated genomic sequences (if available); in brown: gene prediction based on all available alignments; in red: internal tracking database of RefSeq sequences; in purple: selection of the best models and protein naming; in yellow: formatting of annotation sets for deployment to public resources.

From: Eukaryotic Genome Annotation Pipeline

Cover of The NCBI Handbook
The NCBI Handbook [Internet]. 2nd edition.

NCBI Bookshelf. A service of the National Library of Medicine, National Institutes of Health.