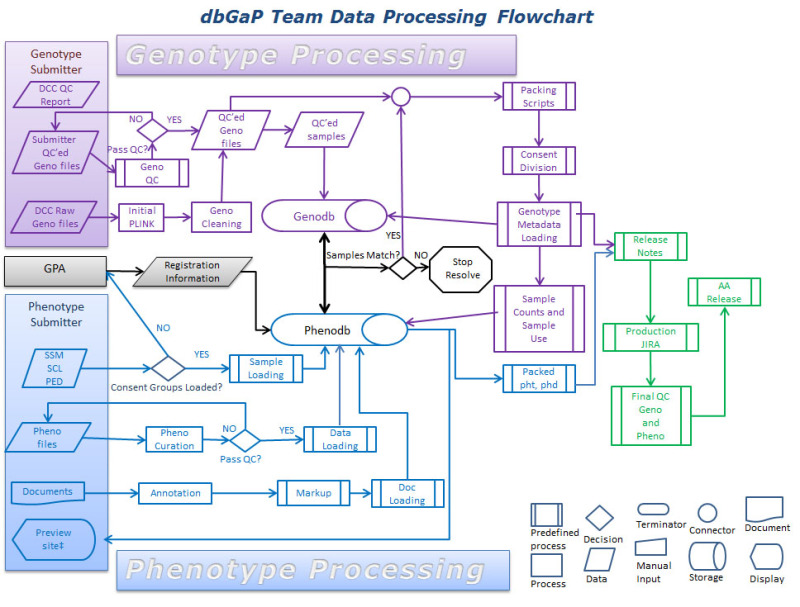
From: The Database of Genotypes and Phenotypes (dbGaP) and PheGenI

The NCBI Handbook [Internet]. 2nd edition.
Bethesda (MD): National Center for Biotechnology Information (US); 2013-.
NCBI Bookshelf. A service of the National Library of Medicine, National Institutes of Health.
