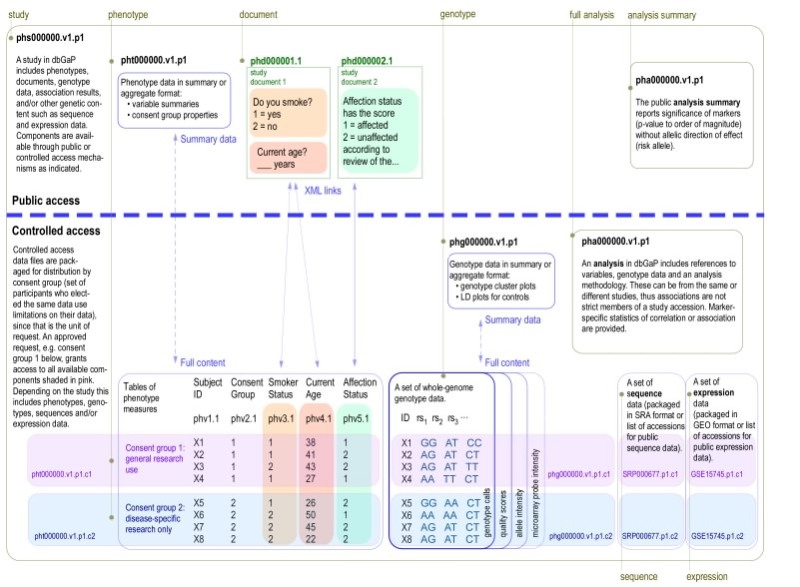
Figure 1. . This figure shows the relationships between dbGaP accessioned objects and whether they are available publicly or only through Controlled Access.

Figure 1.

This figure shows the relationships between dbGaP accessioned objects and whether they are available publicly or only through Controlled Access. This is an updated version of a figure that originally appeared in Mailman, et al. 2007.

From: The Database of Genotypes and Phenotypes (dbGaP) and PheGenI

Cover of The NCBI Handbook
The NCBI Handbook [Internet]. 2nd edition.

NCBI Bookshelf. A service of the National Library of Medicine, National Institutes of Health.