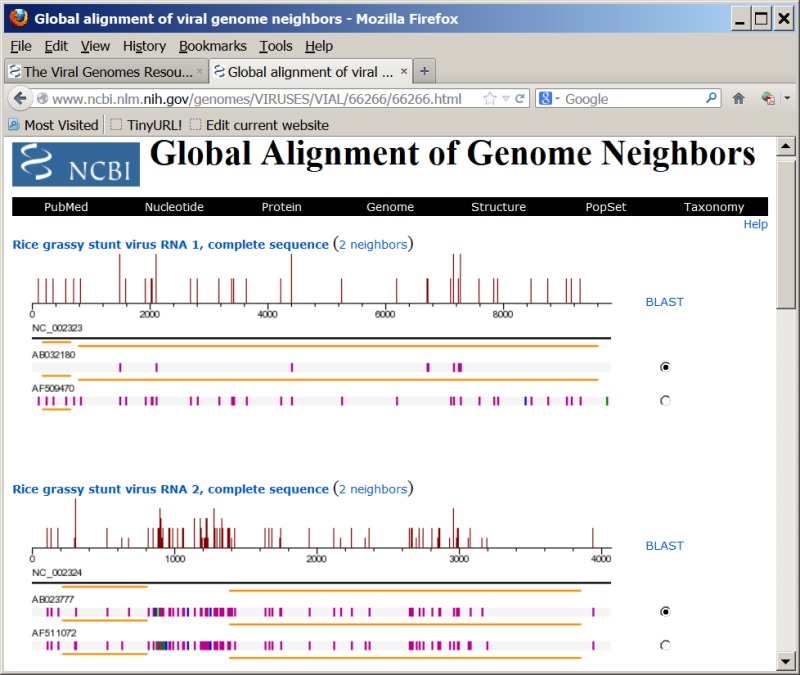
Figure 2. . Global alignment of genome neighbors with the RefSeq of Rice grassy stunt virus (NC_002323 and NC_002324).

Figure 2.

Global alignment of genome neighbors with the RefSeq of Rice grassy stunt virus (NC_002323 and NC_002324). The magenta, blue, and green bars represent differences, deletions, or insertions in sequences, compared with the reference sequence. The orange lines represent coding regions annotated in the genome records. The histogram shows the average density of nucleotide changes (excluding gaps, insertions, and undetermined nucleotides) in all genome neighbors for each reference sequence segment.

From: About Viral and Phage Genome Processing and Tools

Cover of The NCBI Handbook
The NCBI Handbook [Internet]. 2nd edition.

NCBI Bookshelf. A service of the National Library of Medicine, National Institutes of Health.