

NCBI Bookshelf. A service of the National Library of Medicine, National Institutes of Health.
Davies SM, Geppert J, McClellan M, et al. Refinement of the HCUP Quality Indicators. Rockville (MD): Agency for Healthcare Research and Quality (US); 2001 May. (Technical Reviews, No. 4.)

The methods chapter is organized into five sections: 1) Semi-structured interviews, 2) Evaluation Framework, 3) Literature Review, 4) Risk Adjustment Review, and 5) Empirical Methods. A summary description of each of the sections is included below. The remaining sections of the chapter contain the detailed methods.
Summary of Methods
Semi-structured interviews
The project team contacted 37 individuals affiliated with hospital associations, business coalitions, state data groups, federal agencies, and academia. These individuals were identified for their potential expertise in quality measurement. We deliberately included quality indicator (QI) users and potential users from a broad spectrum of organizations in both the public and private sectors; the sample was not intended to be representative of any population. Thirty-one individuals agreed to be interviewed about various topics related to quality measurement. Interviews were tailored to the specific expertise of interviewees (listed in Appendix 2). Two team members collected information during interviews regarding quality indicator use, suggested indicators, and other potential contacts.
Evaluation framework
The project team identified key areas of performance for quality indicators, gathering information from previous evaluations by McGlynn et al., 6 and Iezzoni et al.,7-17 and from the telephone interviews. Six evaluation criteria were identified:
1) Face validity. An adequate quality indicator must have sound clinical and/or empirical rationale for its use. It should measure an important aspect of quality that is subject to provider or health care system control.
2) Precision. An adequate quality indicator should have relatively large variation among providers that is not due to random variation or patient characteristics.
3) Minimum bias. The indicator should not be affected by systematic differences in patient case-mix, including disease severity and comorbidity. In cases where such systematic differences exist, an adequate risk adjustment system should be possible using available data.
4) Construct validity. The indicator should be related to other indicators or measures intended to measure the same or related aspects of quality.
5) Fosters real quality improvement. The indicator should be robust to possible provider manipulation of the system.
6) Application. The indicator should have been used in the past, and/or have high potential for working well with other indicators.
Literature review
The literature review was completed in two phases. The first phase was designed to identify potential indicators. Quality indicators could be applicable to comparisons among providers of health care (e.g., hospitals, health systems) or among geographical areas (e.g., metropolitan service areas, counties); indicators should also be applicable to a majority of providers or areas (e.g. not examining specialized care units). The second phase was designed to evaluate those indicators identified in phase 1 using the criteria in the evaluation framework described above.
Phase 1
To identify potential indicators, we performed a structured review of the literature. Using Medline, we identified the search strategy that returned a test set of known applicable articles in the most concise manner. The final Medical Subject Heading (MeSH) terms used were "hospital, statistic and methods" and "quality indicators." This search resulted in approximately 2600 articles. These articles were screened for relevancy to this project according to specified criteria. The yield from the search and screen was 181 relevant articles.
Information from these articles was abstracted in two stages by clinicians, health services researchers and other team members. In the first stage, preliminary abstraction, we evaluated each of the 181 identified articles for the presence of a defined quality indicator, potential quality indicators, and obvious strengths and weaknesses. To qualify for full abstraction (stage 2 of phase 1), the articles must have explicitly defined a novel quality indicator. Similar to previous attempts to cull new indicators from the peer reviewed literature, few articles (27) met this criterion. Information on the definition of the quality indicator, validation and rationale were collected during full abstraction (stage 2 of phase 1).
Additional potential indicators were identified using the CONQUEST (COmputerized Needs-oriented QUality Measurement Evaluation SysTem) database, the National Library of Healthcare Indicators (developed by JCAHO), a list of ORYX™ approved indicators provided by the Joint Commission on Accreditation of Healthcare Organizations (JCAHO), and from the telephone interviews.
Phase 2
After identifying over 200 potential indicators during Phase 1, we evaluated the indicators. Initially, team members evaluated the clinical rationale of each indicator, and selected the most promising indicators based on certain criteria, including frequency of the event and sound clinical rationale. HCUP I (Healthcare Cost and Utilization Project) indicators were not evaluated in this stage and were automatically selected for the next step of evaluation. Second, those indicators passing the initial screen (including the HCUP I indicators) were subjected to basic empirical tests of precision, as described below. Third, a full literature review was conducted for those indicators with adequate performance on the precision tests. Medline was searched for articles relating to each of the six areas of evaluation, described in the evaluation framework. Clinicians, health services researchers and other team members searched the literature for evidence, and prepared a referenced summary description of the evidence from the literature on each indicator. These indicators also underwent full empirical analyses (see Empirical Methods).
Risk adjustment review
To identify potential risk adjustment systems, we reviewed the applicable literature regarding risk adjustment systems. We examined risk adjustment approaches for each indicator according to the type of indicator (mortality, utilization, etc.) and the analytic approach, method of development, feasibility of implementation given data availability, and empirical measures of discrimination and calibration. In addition, the semi-structured interviews with potential HCUP users identified several preferences for a risk adjustment system for the HCUP QI set. Users preferred that the system be: 1) open, with published logic, 2) cost-effective, with data collection costs minimized, and additional data collection being well justified, 3) designed using a multiple-use coding system, such as those used for reimbursement, and 4) officially recognized by government, hospital groups or other organizations.
Few risk adjustment systems could be feasibly implemented, given the lack of ambulatory and detailed clinical data. In general, Diagnosis Related Group (DRG) systems tended to fit more of the user preference-based criteria than other alternatives. A majority of users interviewed already used All Patients Refined (APR)-DRGs, and APR-DRGs have been reported to perform well in predicting resource use and death, when compared to other DRG based systems. APR-DRGs also performed as well as or better than other risk adjustment systems for several conditions in a series of studies by Iezzoni et al.9-13, 17, 18 As a result, we conducted indicator evaluations with the APR-DRG system for two purposes: 1) to determine the impact of measured differences in patient severity on the relative performance of providers, as described in the Empirical Methods' sub-section, and 2) to provide the basis for implementing APR-DRGs as an optional risk adjustment system for hospital level QI measures. The implementation of APR-DRGs is based on an ordinary least squares regression model and is discussed in detail in the full text of the Risk Adjustment Methods sub-section.
Our incorporation of APR-DRGs into the Version 2 software should not be construed as an unequivocal endorsement of this product. Indeed, customized risk-adjustment systems might be more effective than APR-DRGs or any off-the-shelf product. However, it was beyond the scope of this contract to develop customized risk-adjustment systems for each quality indicator.
Empirical methods
Extensive empirical testing of all potential indicators was conducted (See Tables 1-3 for a summary of empirical tests). In this overview, we provide a summary of the data sets used, and the specific tests for each of the evaluation criteria that were assessed empirically: precision, bias, and construct validity.
Data set
The primary data sets used were the HCUP Nationwide Inpatient Sample (NIS) and the State Inpatient Database (SID) for 1995-1997. The annual NIS consists of about 6,000,000 discharges and over 900 hospitals from participating States. The SID contains all discharges for the included states. Most of the statistical tests used to compare candidate indicators were calculated using the SID, because the provider level results were similar to the NIS, and the SID includes all discharges for the direct calculation of area rates.
Precision
The first step in the analysis involved precision tests to determine the reliability of the indicator for distinguishing real differences in provider performance. Any quality indicator consists of both signal (`true' quality, that is what is intended to be measured) and noise (error in measurement due to sampling variation or other non-persistent factors). For indicators that may be used for quality improvement or other purposes, it is important to know with what precision, or surety, a measure can be attributed to an actual construct rather than random variation. For some indicators, the precision will be quite high for the raw measure. For other indicators, the precision will be rather low. However, it is possible to apply additional statistical techniques to improve the precision of these indicators. These techniques are called signal extraction, and are designed to "clean" or "smooth" the data of noise, and extract the actual signal associated with provider or area performance. We used two techniques for signal extraction to potentially improve the precision of an indicator. Detailed methods are contained in the full text of the methods section. First, univariate methods estimated the "true" quality signal of an indicator based on information from the specific indicator and one year of data. Second, new multivariate signal extraction (MSX) methods estimated the signal based on information from a set of indicators and multiple years of data. In most cases, MSX methods extract additional signal.
For each indicator, the variance can be decomposed into three components: variation within a provider (i.e. differing performance due to differing patient characteristics), variation among providers (i.e. actual differences in performance among providers), and random variation. An ideal indicator would have a substantial amount of the variance explained by between-provider variance, which might possibly result from differences in quality of care, and a minimum amount of random variation.
We conducted four tests of precision (signal standard deviation, provider/area variation share, signal-to-noise ratio and the in-sample r-squared) in order to estimate the magnitude of between-provider variance on each indicator.
(1) Signal Standard Deviation: For the first test of precision, we calculated the signal standard deviation of the QI, which measures the extent to which performance of the QI varies systematically across hospitals or areas. The signal standard deviation is the best estimate of the variation in QI performance that appears to be systematic - truly associated with the hospital or area, and not the result of random variations in patient case mix or environmental conditions. Because many patient characteristics and random events may influence performance of a QI, only some of the apparent variation in performance at the hospital or area level is likely to be systematic. Systematic variation will be larger to the extent that: sample sizes are larger (allowing more precise estimation of the true effect), and patient-associated variation is smaller (allowing more precise estimates for a given sample size). Large systematic variation across hospitals and areas suggests that there are opportunities for further study and quality improvement. By contrast, if the signal standard deviation is small, then there may be little gained by improving the performance of lower-ranked hospitals or areas to the levels achieved by the higher-ranked hospitals or areas.
(2) Provider/Area Share:
Another precision test we calculated is the percentage of signal variance relative to the total variance of the QI. In general, the variance in a quality indicator can be divided as follows:
Total Variance = Patient-Level Variance + Provider-Level Variance.
Typically, most variation in the QIs (e.g., whether or not a vaginal birth occurred for a patient with a prior C-section) is associated with patient-level factors, and may have nothing whatsoever to do with providers or areas. In turn, the apparent Provider-Level Variance (or analogously, Area-Level) can be divided into two components:
Provider-Level Variance = Provider-Level Signal Variance + Noise Variance.
That is, some of the variance in a QI rate for a particular provider (adjusted or unadjusted) is a reflection of random chance 11: in a given year, some hospitals or areas will by chance have more or fewer occurrences of the numerator related to a particular QI. The remaining variance (signal variance), and only the remaining variance, is attributable to systematic or true differences in the QI across providers. The percentage of signal variance relative to total variance will be larger to the extent that: within-hospital patient variance is small; sample sizes are larger; and true differences in performance across hospitals are larger. Unlike the signal standard deviation measure of precision, the percentage of signal variance is a relative measure: relative to the total variation (patient plus provider) in the QI, what fraction appears to be associated with systematic provider differences? Thus, higher percentages suggest enough differences across hospitals or areas that true differences across providers or areas can be distinguished from other "random" influences on QI performance.
(3) Signal-to-Noise Ratio:
The third precision measure we calculated is the Signal-to-Noise ratio in the provider- or area- level variation in the QI measure. This measure answers the question: of the apparent variation in QIs across providers, what fraction appears to be truly related to systematic differences across providers, and not random variations ("noise") from year to year? As noted earlier, the provider-level variation includes both signal variation and random variations in the QI measures across providers ("noise"). In other words, it is the "signal" to "signal plus noise" ratio. As such, the Signal-to-Noise ratio measure is somewhat misnamed. Its definition is:
Signal-to-Noise Ratio = (Provider-Level Signal Variance)/(Provider-Level Total Variance).
In general, if a QI's signal-to-noise ratio is high, then it is likely that apparent variations in performance across providers are not the result of random chance, and careful attention to distinguishing true from random variation across providers will have little impact on the measured performance of a provider. Similarly, for indicators measuring area level rates, the aim is to distinguish between actual and apparent differences between areas.
(4) In-sample R-Squared:
The fourth precision measure identifies the incremental benefit of applying multi-variate signal extraction methods for identifying additional signal on top of the signal-to-noise ratio.
Bias
To provide empirical evidence on the sensitivity of candidate QIs to potential bias from differences in patient severity, we compared unadjusted performance measures for specific hospitals with performance measures that were adjusted for age, gender, and, where possible, patient clinical factors available in discharge data. We used the 3M APR-DRG System Version 12 with Severity of Illness and Risk of Mortality subclasses, as appropriate, for risk adjustment of the hospital quality indicators. Nonetheless, we recognize that this system is not ideal, because it provides only four severity levels within each base APR-DRG, omits important physiologic and functional predictors, and potentially misadjusts for iatrogenic complications. For a few measures, no APR-DRG severity categories were available, so that unadjusted measures were compared to age-sex adjusted measures. Because HCUP data do not permit the construction of area measures of differences in risk, only age-sex adjustment is feasible for the area-level indicators evaluated. We used a range of bias performance measures, most of which have been applied in previous studies.9-13, 17-19 We note that these comparisons are based entirely on discharge data. In general, we expect performance measures that are more sensitive to risk adjustment using discharge data also to be more sensitive to risk adjustment using more complete clinical data, though the differences between the adjusted and unadjusted measures may be larger in absolute magnitude than the discharge data analysis would suggest. However, there may not be a correlation between discharge and clinical-record adjustment. Specific cases where previous studies suggest a greater need for clinical risk adjustment are discussed in our literature reviews of relevant indicators. To investigate the degree of bias in a measure, we performed five empirical tests. Each test was repeated for the "raw" data, for data smoothed by univariate techniques (one year of data, one indicator), and for data smoothed by multivariate (MSX) techniques (using multiple years of data, all indicators).
- Rank Correlation Coefficient: The Spearman correlation coefficient of the rank of the area/hospital without and with risk adjustment gives the overall impact of risk adjustment, on relative provider or area performance.
- Average Absolute Value of Change Relative to Mean: The average absolute change in the performance measure of the hospital or area with and without risk adjustment, normalized by the average value of the QI. Thus, it is also a relative measure that theoretically can range from zero (no change) to a much higher value. This measure highlights the amount of absolute change in performance, without reference to other providers' performance. This does not rely on the distribution of performance on this indicator, as relative performance measures do.
- Percentage of High That Remains High Decile, or
- Percentage of Low Decile That Remains in Low Decile: These two measures report the percentage of hospitals or areas that are in the highest and lowest performance deciles without risk adjustment, that remain there with risk adjustment. A measure that is insensitive to risk adjustment should have rates of 100%, whereas measures for which risk adjustment affects the top- and bottom-performers substantially should have much lower percentages.
- Percentage That Change More Than Two Deciles: the percentage of hospitals whose relative rank changes by a substantial distance - more than 20% - with and without risk adjustment. Ideally, risk adjustment would not have a substantial effect for very many hospitals.
Construct validity
Two measures of the same construct would be expected to yield similar results. If quality indicators do indeed measure quality, at least in a specified domain, such as ambulatory care, one would expect measures to be related. As quality relationships are likely to be complex, and outcomes of medical care are not entirely explained by quality, perfect relationships between indicators seem unlikely. Nonetheless, we would expect to see some relationships between indicators.
To measure the degree of relatedness between indicators, we conducted a factor analysis, a statistical technique used to reveal underlying patterns among large numbers of variables. The output for a factor analysis is a series of "factors" or overarching constructs, for which each indicator would "load" or have a relationship with others in the same factor. The assumption is that indicators loading strongly on the same factor are related to each other via some independent construct. We used an orthogonal rotation to maximize the possibility that each indicator would load on one factor only, to ease the interpretation of the results. In addition to the factor analysis, we also analyzed correlation matrices for each type of indicator (provider level, ambulatory care sensitive condition (ACSC) area level, and utilization area level).
The construct validity analyses provided information regarding the relatedness or independence of the indicators. Such analyses cannot prove that quality relationships exist, but they can provide preliminary evidence on whether the indicators appear to provide consistent evidence related to quality of care. For hospital volume quality indicators, we evaluated correlations with other volume and hospital mortality indicators, to determine whether the proposed HCUP II indicators suggested the same types of volume-outcome relationships as have been demonstrated in the literature.
Results of empirical evaluations
Statistical test results for candidate indicators were compared. First, the results from precision tests were used to sort the indicators. Those indicators performing poorly were eliminated. Second, the results from bias tests were conducted to determine the need for risk adjustment. Finally, construct validity was evaluated to provide some evidence on the nature of the relationship between potential indicators.
Detailed Methods
2.A. Semi-structured Interviews
The project team and previous developers of the Healthcare Cost and Utilization Project Quality Indicators (HCUP I QIs) developed a contact list of individuals associated with hospital associations, business coalitions, state data groups, and federal agencies. This list was designed to include QI users and potential users from a broad spectrum of organizations in both the public and private sectors; it was not intended as a representative sample. All contacts were faxed an introductory letter and asked to participate as advisors on the project with a short telephone interview. This request was well received; only six out of 37 declined participation themselves without suggesting an alternative respondent. Overall, the 31 contacts phoned expressed interest in the study, offering many suggestions and comments (see Appendix 2, List of Contacts). The composition of the 31 interviewees is as follows: three consultants, two federal agency employees, one health plan medical director, five representatives of hospital associations, one international academic researcher, four representatives of private accreditation groups, two representatives of private data groups, two members of professional organizations, five representatives of provider and other private organizations, three representatives of state data groups, and three representatives of other healthcare organizations.
The semi-structured interviews were designed to identify potential indicators, concerns of end users, and other factors important in the development of quality indicators that may not be captured in the published literature. Thus, academic researchers, whose work is more likely to appear in peer reviewed journals were reserved as peer reviewers for the final document. As a result, the results of the semi-structured interviews are not intended to be a non-biased representation of the opinions regarding quality indicators, but rather a sampling of those opinions not likely to be available in the peer-reviewed literature.
Two team members (CV, JG) conducted the interviews. The interviewers solicited information on the development and use of quality indicators by the targeted organizations, as well as other known measures and additional contacts. Interviewers used a semi-structured interview and recorded information from the interview on a data-collection form. Further, some advisors provided the project team with materials regarding quality indicators and the use of HCUP I indicators.
2.B. Quality Indicators Evaluation Framework
Six areas were considered essential for evaluating the reliability and validity of a proposed quality indicator. Several sources contributed to the development of the evaluation criteria framework: 1) results of the semi-structured interviews, including the interests and concerns of HCUP users, 2) task order document describing the Agency for Healthcare Research and Quality's (AHRQ) interests, 3) evidence available in the policy and research literature and 4) evidence available through statistical analyses. Our six criteria are quite similar to the criteria for "testing the scientific strength of a measure" proposed by McGlynn and Asch. 6 They describe a measure as reliable "if, when repeatedly applied to the same population, the same result is obtained a high proportion of the time." They propose evaluating validity in terms of face validity, criterion validity ("an objective assessment of the ability of the measure to predict a score on some other measure that serves as the evaluation criterion"), and construct validity ("whether the correlations between the measure and other measures are of the right magnitude and in the right direction"). We view criterion validity as an assessment of bias (criterion #3), where the "gold standard" measure is purged of bias due to severity of illness. Face validity captures a variety of concepts discussed by McGlynn and Siu 20 , including the importance of the condition, the efficacy of available treatments (e.g., the ability of providers to improve outcomes), and the potential for improvement in quality of care.
We assembled the evidence supporting the use of current and candidate HCUP II quality indicators in terms of the following six areas.
- Face validity: does the indicator capture an aspect of quality that is widely regarded as important and subject to provider or public health system control?
- Precision: is there a substantial amount of provider or community level variation that is not attributable to random variation?
- Minimum Bias: is there either little effect on the indicator of variations in patient disease severity and comorbidities, or is it possible to apply risk adjustment and statistical methods to remove most or all bias?
- Construct validity: does the indicator perform well in identifying true (or actual) quality of care problems?
- Fosters real quality improvement: Is the indicator insulated from perverse incentives for providers to improve their reported performance by avoiding difficult or complex cases, or by other responses that do not improve quality of care?
- Application: Has the measure been used effectively in practice? Does it have potential for working well with other indicators?
In addition to the above framework, we followed the Donabedian paradigm of structure, process, and outcome21, 22 to categorize current (HCUP I) and candidate (HCUP II) QIs. For example, potentially inappropriate utilization falls into the category of process, while in-hospital mortality, adverse events, and complication rates represent outcome measures.
We considered three broad audiences for the quality measures: health care providers and managers, who would use the quality measures to assist in initiatives to improve quality; public health policy-makers, who would use the information from indicators to target public health interventions; and health care purchasers and consumers, who would potentially use the measures to guide decisions about health policies and providers. Because of the limitations of quality indicators derived based on administrative data, we focus primarily on applications oriented to "screening for potential quality problems." For the purpose of the Evaluation Framework, indicators must at least pass tests indicating that they are appropriate for the use of screening. In the rest of this section, we provide a more detailed explanation of each part of the Evaluation Framework, considering these three audiences wherever differences have been noted in the literature.
1. Face validity: does the indicator capture an aspect of quality that is widely regarded as important and subject to provider or public health system control?
This question considers the degree to which potential users view the quality indicator as important and informative. There are two parts to this question: Does the indicator relate to an aspect of health care that users regard as important? And does performance on the measure credibly indicate high quality care? Obviously, face validity will be influenced by how well the indicator performs in the other areas covered in our Evaluation Framework. Clinicians tend to distrust outcome measures because of concerns over the adequacy of risk adjustment and the multiple factors beyond providers' control that contribute to poor outcomes. Other critics add that outcome measures suffer from imprecision (with random noise outweighing provider differences) and important selection biases (e.g., due to variations in admitting practices). Addressing this issue at the outset serves as a point of reference for the findings of our literature review and empirical analysis.
Broadly speaking, consumers, health care payers, regulators, and public health officials are likely to be most interested in measures based on outcomes that are relatively frequent, costly, and/or have serious implications for an individual's health. In addition, there should be reason to believe that the outcome may be (at least somewhat) under providers' control (in other words, controlled trials or well-designed cohort studies have shown that specific diagnostic or therapeutic modalities may reduce its frequency or severity). Outcome measures might include operative mortality rates, or mortality after hospitalization with serious acute illnesses such as a heart attack.These measures seem most intuitive, since they assess the main outcomes that medical treatments are intended to affect. Perhaps surprisingly, however, reports of hospital mortality rates appear to have little effect on where patients seek their care.23, 24 One reason may be that many patients describe difficulty in interpreting indicators involving mortality and morbidity rates, and consequently view them as unhelpful. 25 Another reason may be that providers prefer measures of process, particularly if there is reason to believe (generally from randomized controlled trials) that certain processes truly lead to better patient outcomes. Patients appear to prefer reports of other patients' satisfaction with care, and especially informal recommendations from family, friends, and their own physicians. 25 Thus, developing indicators with high face validity for patients may require active participation from patients,26, 27 targeting aspects of care identified as important in patient surveys,28-35 or taking additional steps to enhance provider perceptions about the validity of outcome measures.
Many providers view outcome-based QIs with considerable skepticism. 36 For most outcomes, the impacts of random variation37-42 and patient factors beyond providers' control often overwhelm differences attributable to provider quality. Consequently, providers tend to support measures of quality based on processes of care that have been documented in clinical trials to lead to better health outcomes in relatively broad groups of patients43-46 - for example, the processes of acute MI care measured in the Cooperative Cardiovascular Project.47, 48 Such process measures focus precisely on the aspects of care under providers' control. As long as the process measures are based on evidence of effectiveness, they serve as useful proxies for outcome measures that would otherwise be difficult to observe or measure. For example, when using inpatient discharge data only, it is not possible to ascertain out-of-hospital mortality. In general, process measures are not as noisy as outcome measures because they are less subject to random variation. They also suggest specific steps that providers may take to improve outcomes or reduce costs - even if such outcome improvements are difficult to document at the level of particular providers.
The relationship between some structural quality measures and important outcomes has been well-documented, although some concerns remain about the interpretation of the measures.21, 22, 49, 50 These measures include measures of hospital volume for volume-sensitive conditions,51-66 technological capabilities (e.g., ability to perform certain intensive procedures like coronary angioplasty),67-73 and teaching status.73-79 All of these measures have limited face validity, because they are widely acknowledged to be weak surrogates for true quality of care. 80 For example, many low-volume hospitals have been shown to achieve excellent outcomes, whereas many high-volume hospitals have surprisingly poor outcomes.
2. Precision: is there a substantial amount of provider or community level variation that is not attributable to random variation?
The impact of chance on apparent provider or community health system performance must be considered. Unobserved patient and environmental factors may result in substantial differences in performance among providers in the absence of true quality differences. Moreover, the same providers may appear to change from year to year, in the absence of changes in the care they deliver. Thus, using "raw" quality data will often result in poorly reproducible, or imprecise, measurements, giving an incorrect impression of provider quality.
An extensive literature on the importance of random variations in quality measures now exists.37, 39-42, 81-86 In general, random variation is most problematic when there are relatively few observations per provider, when adverse outcome rates are relatively low, and when providers have little control over patient outcomes or when variation in important processes of care is minimal. If a large number of patient factors that are difficult to observe influence whether or not a patient has an adverse outcome, it may be difficult to separate the "quality signal" from the surrounding noise. We review the evidence on the precision of each of the evaluated QIs. Empirical methods can be used to assess both the importance of sample size and the importance of provider effects (versus patient and area effects) in explaining observed variation in the measure. But this is not entirely a statistical question, and considerations of mechanisms and concerns related to face validity can also be helpful in assessing the precision of a measure. For example, if better hospitals invariably admit sicker patients, then the apparent variation in a measure at the hospital level will be significantly less than the true variation (see the discussion of unbiasedness below). In such a case, other sources of evidence suggesting that a measure is valid or that such bias exists can be helpful in assessing the quality measure. Our literature review encompasses both empirical and other sources of evidence on measure precision, and our empirical analysis presents systematic evidence on the extent of provider-level or area-level variation in each quality measure.
Statistical techniques can account for random variations in provider performance by estimating the extent to which variation across providers appears to be clustered at the provider level, versus the extent to which it can be explained by patient and area effects.86-89 Under reasonable statistical assumptions, the resulting estimates of the extent to which quality truly varies at the provider or area level can be used to "smooth" or "shrink" estimates of the quality of specific providers or areas. The methods are Bayesian: the data used to construct the quality measures are used to update a "prior" distribution of provider quality estimates, so that the "posterior" or smoothed estimate of a provider's (or area's) quality is a best guess, reflecting the apparent patient- and provider-level (or area-level) variance of measure performance.
3. Minimum Bias: is there either little effect on the indicator of variations in patient disease severity and comorbidities, or is it possible to apply risk adjustment and statistical methods to remove most or all bias?
A QI may exhibit precision, but nonetheless yield inaccurate results due to systematic measurement biases. Extensive research has documented the importance of selection problems in interpreting many quality measures, especially measures related to mortality.90-94 Such biases may have two basic forms: differences in admitting practices between two hospitals produce non-random samples from the same underlying patient population (selection biases) or the patient populations may in fact contain different case-mixes. Selection effects presumably exert a greater influence on measures involving elective admissions and procedures, for which physician admission and treatment practice styles show marked variation.74, 75 Nonetheless, selection problems exist even for conditions involving urgent "non-discretionary" admissions, likely due to modest practice variation 95 and non-random distribution of patient characteristics across hospital catchment areas. 77 The attention of researchers and quality analysts has focused on developing valid models to adjust for patient factors, especially when comparing hospital mortality.90, 92
The principal statistical approach to address concerns about bias is risk adjustment.12, 15, 78, 79, 96-102 Numerous risk adjustment instruments currently exist, 15 but current methods are far from perfect.15, 16 In general, risk adjustment methods are based on data drawn from two sources, administrative data and medical chart reviews. 12 Previous studies suggest that administrative data have at least two major limitations. First, coding errors and variations are common: some diagnoses are frequently entered with errors and with some inconsistency across hospitals.103-105 Factors affecting the accuracy of these codes include restrictions on the number of secondary diagnoses permitted,106, 107 as well as systematic biases in documentation and coding practices introduced by awareness that risk-adjustment and reimbursement are related to the presence of particular complications.108-111
Second, most administrative data sources do not distinguish disorders that can be in-hospital complications from pre-existing comorbidities.12, 112 To the extent that diagnoses such as shock and pulmonary edema may result from poor quality of care, their incorporation in prediction models may bias estimates of expected mortality, and even favor hospitals whose care results in more complications. One proprietary risk-adjustment system has been shown to be significantly biased by its inclusion of conditions that actually developed after admission, 113 but this study was limited to one condition (acute MI) and its conclusions are somewhat controversial. 114 In another study, estimates of mortality differences between municipal and voluntary hospitals in New York City were substantially affected by whether potential complications were excluded from risk-adjustment. 79 New York and California have recently added a "6th digit" to ICD-9 codes to distinguish secondary diagnoses present at admission from those that developed during hospitalization. This refinement may allow valid comparisons of risk-adjusted mortality using administrative data for certain conditions, 115 although the accuracy of the "6th digit" has not been established.
Clinically-based risk adjustment systems supplement hospital discharge data with information available from medical records. Because exact clinical criteria can be specified for determining whether a diagnosis is present, coding errors are diminished. In addition, complications can be distinguished from comorbidities focusing on whether the diagnosis was present at admission. 15 Because the number of clinical variables that may potentially influence outcomes is small, and because these factors differ to some extent across diseases and procedures, progress in risk-adjustment has generally occurred by focusing on patients with specific conditions. Thus, sophisticated chart-based risk adjustment methods have been developed and applied for interpreting mortality rates for patients undergoing cardiac surgery54, 116-118 and interventional cardiology procedures, 101 critically ill patients,119, 120 patients undergoing general surgery, and medical patients with acute myocardial infarction, 47 community-acquired pneumonia, 121 and upper gastrointestinal hemorrhage. 122
However, chart-based risk adjustment methods are not without their own limitations. First, especially for severely ill patients and those who die soon after admission - some of the most important patients for computing many quality measures - complete diagnosis information may not have been ascertained prior to death, and therefore would not be in the patient's medical record. Important observations might be missing for such patients, resulting in biased estimates in the risk-adjusted model. Second, medical chart reviews are very costly, and so routine collection of detailed risk information is not always feasible. As a result, the impact of chart-based risk adjustment may vary across measures. For some measures, its impact is modest and does not substantially alter relative rankings of providers.19, 123-125 For others, it is much more important.9-13, 18, 112 Of course, because all risk adjustment methods generally leave a substantial amount of outcome variation unexplained, it is possible that unmeasured differences in patient mix are important even in the most detailed chart-based measures.
For each quality measure, our report reviews the evidence on whether important systematic differences in patient mix exist at the provider and community level, and whether various risk adjustments significantly alter the quality measure for particular providers. We distinguish between risk adjustment methods that rely only on administrative data and have been validated with clinical data, and those that are not validated. Risk adjustment methods requiring clinical data cannot be applied to the HCUP data, and therefore are not covered in this report. Our empirical analysis then assesses whether a common approach to risk adjustment using administrative data - the All Patient Refined Diagnosis Related Groups (APR-DRG) system developed by 3M™ - significantly alters the quality measure for specific providers. We emphasize impact on relative measures of performance - whether risk adjustment affects which hospitals are regarded as high- or low-quality - rather than absolute measures of performance - whether risk adjustment affects a hospital's quantitative performance on the quality measure. As noted above, we recognize that this system is not ideal, because it provides only four severity levels within each base APR-DRG, omits important physiologic and functional predictors, and potentially misadjusts for iatrogenic complications.
A remaining methodological issue concerns the appropriateness of adjusting for certain "risk factors."126-135 For example, "Do Not Resuscitate" status may be associated with differences in care that not only reflect patient preferences (e.g., less use of intensive treatments) but also true differences in quality of care (e.g., inadequate physician visits), resulting in increased complications that would result in a "Do Not Resuscitate" order, and increased mortality. 136 Importantly, the prevalence of patients with DNR status may vary nonrandomly between hospitals, with large referral centers having greater percentages of patients seeking (and receiving) aggressive medical care. 137
Adjusting for race implies that patients of different races respond differently to the same treatments, when patients of different races may actually receive different treatments. A substantial literature documents systematic differences in the care delivered to patients by race and gender.125, 138-144 For example, African-American diabetics undergo limb amputations more often than do diabetics of other races. 145 Thus, we note wherever possible if review of the literature indicates particularly large differences in a quality measure by race or gender. Some gender or race differences may be due to either patient preference, or physiological differences that would be appropriate to include in a risk adjustment model. In other cases differences denote lower quality care, and in this case race and gender should not be included in the risk adjustment model. Where applicable this is noted in the literature review.
4. Construct validity: does the indicator perform well in identifying providers with quality problems?
Ideally, a hospital will perform well on a quality measure if and only if it does not have a significant quality problem, and will perform poorly if and only if it does. In practice, of course, no measure performs that well. Our analyses of noise and bias problems with each measure are intended to assess two of the principal reasons why a hospital might appear relatively good or bad (or not appear so) when it really is not (or really is). Detecting quality problems is further complicated by the fact that adverse outcomes are often the result of the course of an illness, rather than an indication of a quality problem at a hospital. Formally, one would like to know the sensitivity and specificity of a quality measure, or at least the positive predictive value (PPV) of a quality measure for detecting a true hospital quality problem. 2 2
When available, for each measure, we reviewed any existing literature on its sensitivity or PPV for true provider quality problems. In most cases, however, we found no true gold standard, or ideal measure of quality. We therefore tested construct validity - i.e., our construct is that different measures of quality, on the same patients, should be related to each other at the provider level, even if it isn't always clear which measure is better. It may be easier to ask "is the indicator correlated with other, accepted measures of quality at the provider level?" rather than "does the indicator perform well in identifying providers with quality problems?" For example, studies have validated survey rankings of "best" hospitals by examining the relation with actual process and outcome measures for AMI, 146 and peer review failure rates with HCFA risk-adjusted mortality rates. 147
5. Fosters real quality improvement: Is the indicator insulated from perverse incentives for providers to improve their reported performance by avoiding difficult or complex cases, or by other responses that do not improve quality of care?
Ideally, when quality measures are used to guide quality improvement initiatives or reward good providers, the best way for a provider to perform well on the measure is to provide high-quality care. Unfortunately, many quality indicators appear to at least leave open the possibility of improving measured performance without improving true quality of care.
In measures that are risk-adjusted, measured performance can be improved by "upcoding" - including more comorbid diagnoses in order to increase apparent severity of illness.86, 111 Systematic biases in diagnostic codes were observed after the introduction of the Prospective Payment System,108-110 and may also explain much of the apparent reduction in adjusted mortality attributed to the Cardiac Surgery Reporting System in New York. 111 The extent to which upcoding is a problem probably increases with the ambiguity of the specific data element, and decreases when auditing programs maximize the reliability and validity of submitted data. In recent years, an aggressive auditing program has significantly reduced the extent to which comorbidities not substantiated by the medical chart are recorded for Medicare patients, leading some analysts to conclude that "upcoding" is no longer as substantial of a problem for Medicare patients. 148 However, such audit standards have generally not been imposed on the state discharge databases used in the HCUP project. In our review, we note indicators for which risk adjustment appears to be important, and thus upcoding is a potentially important problem.
Indicators capturing patient morbidity, such as adverse events and complications, must overcome a reporting bias in the reverse direction - i.e., towards under-reporting. With some exceptions, most hospitals in most states rely on voluntary incident reporting for adverse events. Such methods are known to detect only a fraction of true adverse drug events (ADEs). 149 The Institute of Medicine has recently recommended mandatory reporting systems for adverse events emanating from certain egregious errors. 150 However, the JCAHO's sentinel reporting system tracks many of these same errors (e.g., operating on the wrong patient or body part, suicide or rape of an inpatient), and it was received very negatively by hospitals, despite being a voluntary system. Thus, the degree to which mandatory reporting requirements alleviate or exacerbate reporting bias for adverse events remains to be seen. In addition, high-qualityhospitals with sophisticated error detection systems may report errors more frequently, leading to high apparent complication rates in hospitals that may have superior quality in other dimensions.151-153
Perverse incentives may arise from the criteria used to define or identify the target patient population. For instance, restricting mortality measures to inpatient deaths potentially allows hospitals to lower their mortality rates simply by discharging patients to die at home or in other institutions.106, 115, 154, 155 Measures of surgical site infections156, 157 and other complications of hospital care 158 that only capture in-hospital events will similarly reward hospitals that merely reduce length of stay by discharging or transferring high-risk cases. Early concerns that surgeons in New York avoided operating on high-risk patients 159 may have proved unfounded,160, 161 though this issue remains unsettled. 162 In general, the incentive for providers to avoid treating sicker patients remains a significant concern for outcome-based quality measures. 86
We reviewed the available evidence on each of these possible undesirable responses to the use of each quality measure. For the most part evidence was lacking on responses to indicators, particularly since many of the proposed indicators have not been subjected to public reporting. We noted potential responses when appropriate.
6. Prior use: Has the measure been used effectively in practice? Does it have potential for working well with other indicators?
While important problems exist with many specific applications of HCUP and other quality indicators, they have been applied in a range of settings. As noted in the section on face validity, these applications broadly include initiatives to improve provider quality and initiatives to provide quality-related information to providers and consumers. For each quality indicator, we reviewed studies describing its use in these activities. However, we did not conduct a thorough review of the non-peer reviewed literature. Therefore, indicators may have been adopted, and may continue to be used, by many provider organizations or government agencies without our knowledge.
A recent systematic review more comprehensively summarizes the literature on the impact of performance reports on consumers, providers, and purchasers. 163 Useful and accurate information on quality remains a desirable goal for consumers and providers alike. The interest in quality and the resulting data and research has had some impact on the field of health services research. For instance, the HCUP project has provided a valuable resource for a number of studies in health services research.3, 133-135, 164-177
2.C. Literature Review of Quality Indicators
We conducted a literature review to identify quality indicators reported as such, and potential quality measures. The result of this first stage was a comprehensive list of measures that could be defined based on routinely collected hospital discharge data. In the second phase, we searched the literature for further evidence on these indicators to provide information on their suitability for the HCUP II QI set. This second phase resulted in a comprehensive bibliography for each indicator. In addition, a sub-set of the entire indicator list was selected for detailed review using specific evaluation criteria (described in Section 2.B). The entire process for this systematic review of the literature is diagrammed in Flow Diagram 1, and described in the following sections.
Figure
Flow Diagram 1. Literature review strategy. Phase 1. Identification of indicators Phase 2. Evaluation of indicators
Phase 1: Identification of Indicators
Step 1: Selecting the articles
To locate literature pertaining to quality indicators, we conducted a strategic literature search using the Medline database. We compared over 30 search strategies using Medical Subject Headings (MeSH) based on their ability to retrieve a set of key articles known to the project team. Successful combinations of MeSH term searches returned all the key articles. The final MeSH terms used were "hospital, statistic and methods" and "quality indicators." Articles were also limited to those published in 1994 or later. Articles prior to 1994 had been reviewed for HCUP I development. This search returned the highest number of known key articles in the most concise manner, returning approximately 2,600 articles.
Articles were screened using the titles and abstracts for preliminary abstraction. To qualify for preliminary abstraction the articles must have described a potential indicator or quality relationship that could be adequately defined using administrative data, and be generalizable to a national data set. For the purpose of this study, a quality indicator was defined as an explicit measure (defined by the developer) of some aspect of healthcare quality. Some literature defines only a quality relationship, in that the articles expounds on a process or structural aspect of a healthcare provider that is related to better outcomes. However, the author does not specifically define or recommend that the relationship be used as a quality measure. In this case, the article only describes a quality relationship, not a quality indicator. Only 181 articles met the criteria for preliminary abstraction (See Appendix 3 for a list of abstracted articles). This reflects the small number of quality indicators with published formal peer-reviewed evaluations.
Step 2: Preliminary abstraction
The preliminary round was designed to screen articles for applicability and quality, to obtain and assess the clinical rationale of the indicators, and to identify those articles with enough detail for a more comprehensive abstraction. Nine abstractors participated in this phase. Five of these abstractors were medical doctors with health services research training. The remaining four abstractors were familiar with the project and the literature, and included a project manager (JG), the research coordinator (SD) and two undergraduate research assistants (PC, MW).
The articles were sorted into clinical groupings. The research coordinator rated these clinical groupings according to the amount of clinical knowledge required to abstract the articles. Those requiring the most clinical knowledge were assigned to physicians, while those requiring the least clinical knowledge were assigned to the undergraduate research assistants. Abstractors selected clinical groupings that were of interest or that corresponded to their clinical specialties.
Abstractors recorded information about each article on a one-page abstraction form (see Appendix 4, Data Collection Forms, Preliminary Abstraction Form). Information coded included:
- Indicator type (i.e. mortality, readmission, potentially overused procedures)
- Clinical domain (i.e. medical, surgical, obstetric, pediatric, and psychiatric)
- Measure category (i.e. structure, process, proxy-outcome, and outcome)
- Clinical rationale for the indicators.
- Use of longitudinal data.
- Use of data beyond hospital discharge data.
- Strengths and weaknesses identified by the author.
- Strengths and weaknesses not identified by the author.
Each abstraction form was reviewed by the research coordinator for quality of the abstraction, and for accuracy of the coding. All data were then entered into a Microsoft Access database.
Step 3: Full abstraction
The purpose of the full abstraction phase was to identify potential indicators for the HCUP II QI set, and to assess the evidence for validity of existing indicators. To accomplish this, only articles that described an indicator in conjunction with specific and comprehensive information on its validity were fully abstracted. Four of the original abstractors participated in this phase of the abstraction. Three of these abstractors were medical doctors, the fourth a master's level research coordinator.
Each of the articles for preliminary abstraction, and the corresponding abstraction form was reviewed by both the research coordinator and the project manager independently. To qualify for full abstraction the articles needed to meet the previously noted criteria, and the following criteria:
- Define a quality indicator, as opposed to only a relationship that was not formulated or explicitly proposed as a measurement tool.
- Discuss a novel indicator, as opposed to indicators defined elsewhere and used in the article only to discuss its relationship with another variable (i.e. SES, race, urbanization).
- Define an indicator based on administrative data only.
Only 27 articles met these formal criteria (see Appendix 3). This highlights an important aspect of the literature on quality indicators: most indicators are based on published clinical literature to identify important patient and provider characteristics and processes of care for specific clinical conditions; there is also a substantial literature on technical aspects such as severity adjustment, coding and data collection. It should be noted that, while only 27 articles qualified for formal abstraction, these are not the only useful articles. Many articles provide important information about quality measurement. However, few quality indicators are specifically defined, evaluated, and reported in the literature besides descriptive information on the process of development (the Complication Screening Program is a noteworthy and laudable exception, in that it has been extensively validated in the published literature, mostly by the developers). This evidence report will be an important contribution to the paucity of literature on indicator validation.
An abstraction form was filled out for each indicator defined in an article. The abstraction form coded the following information (see Appendix 4, Data Collection Instruments, Indicator Abstraction Form):
- All the information coded in the preliminary abstraction form.
- Measure administrative information (i.e. developer, measure set name, year published).
- Level of care (primary (prevention), secondary (screening or early detection) or tertiary (treatment to prevent mortality/morbidity)).
- Scoring method (i.e. rate, ratio, mean, proportion).
- A priori suggested quality standard (i.e. accepted benchmark, external comparison, and internal comparison).
- Indicator definition (Numerator, denominator statements, inclusions, and exclusions).
- Extent of prior use.
- Current status (i.e. measure defined, pilot tested, implemented, discontinued).
- Scientific support for measure (i.e. published guidelines, clinician panel, literature review, revision of pre-existing instruments, theory only).
- Other essential references for the measure.
- Validity testing.
- Risk adjustment.
If the measure included risk adjustment, a separate form for the risk adjustment method was filled out (see Appendix 4, Data Collection Instruments, Risk Adjustment Abstraction Form). This included:
- Method administrative information.
- Adjustment rationale.
- Classification or analytic approach (i.e. stratification, logistic or linear regression)
- System development method (i.e. logistic regression, score based on empirical model, a priori/clinical judgement).
- Published performance for discrimination and calibration.
- Use of co-morbidities, severity of illness, or patients demographics.
- Use of longitudinal data, or additional data sources beyond discharge data.
- Extent of current use.
- Other essential references for the method.
- Abstractor comments.
The abstraction forms were reviewed by the research coordinator and entered into a Microsoft Access database.
Parallel Step: Supplementing literature review using other sources
Because the literature in this area is not the primary source for reporting the use of quality indicators, we compiled a list of suitable indicators from a variety of sources. As previously noted, the phone interviews with project advisors led to information on some indicators. In addition, we searched the world wide web sites of known organizations using quality indicators, the CONQUEST database, National Library of Healthcare Indicators (NLHI), developed by the Joint Commission on Accreditation of Healthcare Organizations (JCAHO), and a list of ORYX approved indicators provided by the JCAHO. Indicators that could be defined using administrative data were recorded in an indicator database.
Breakdown of indicators by primary source
During Phase 1, we found that no one literature search was sufficiently sensitive for the purpose of identifying either quality indicators or quality relationships. In addition, we found relatively little literature defining quality indicators. In order to be confident that we identified a large percentage of the quality indicators in use we also performed the parallel step above. This parallel step led us to websites, organizations, and additional literature describing quality indicators. In general, most volume, utilization, and ACSC indicators have been described primarily in the literature. On the other hand, the primary sources for most mortality and length of stay indicators were current users or databases of indicators. However, many indicators found in the literature, were also reported by organizations, and vice versa. Thus, it is difficult to delineate which indicators were derived only from the literature, and which were derived from the parallel step describedabove.
Phase 2: Evaluation of Indicators
The result of Phase 1 was a list of potential indicators with varied information on each depending on the source. Since each indicator relates to an area that potentially screens for quality issues, we developed a structured evaluation framework to determine measurement performance. A series of literature searches were then conducted to assemble the available scientific evidence on the quality relationship each indicator purported to measure. Due to limited resources, we could not review all of the indicators we identified in Phase 1, and therefore selected some for detailed review using the evaluation framework. The criteria used to select these indicators are described later.
Step 1. Evaluation framework development
As described previously, a structured evaluation of each indicator was developed and applied to assess indicator performance in six areas:
- Face validity
- Precision
- Minimum Bias
- Construct Validity
- Fosters Real Quality Improvement
- Prior use
Step 2. Identification of the evidence
We searched the literature for evidence in each of the six areas of indicator performance described above, and in the clinical areas addressed by the indicators. The search strategy used for Phase 2 began with extensive electronic searching of MEDLINE, 178 PsycINFO, 179 and the Cochrane Library. 180 3 3 Thus, in contrast to conducting systematic reviews of purely clinical topics, we reasoned that the European literature not captured in the Medline database or Cochrane Library would almost certainly represent studies of questionable relevance to the US health system.
The extensive electronic search strategy involved combinations of MeSH terms and keywords pertaining to clinical conditions, study methodology, and quality measurement (see Figure 2).
Figure
Figure 1. Abbreviated diagram of literature review.
Figure
Figure 2. Example search strings.

Additional literature searches were conducted using specific measure sets as "keywords". These included "Maryland Quality Indicators Project," "HEDIS and low birth weight, or cesarean section, or frequency, or inpatient utilization," "IMSystem," "DEMPAQ," and "Complications Screening Program."
We also searched the bibliographies of key articles, and hand searched the Tables of Contents of general medical journals, as well as journals focusing in health services research or in quality measurement. This list of journals included Medical Care, Health Services Research, Health Affairs, Milbank Quarterly, Inquiry, International Journal for Quality in Healthcare, and the Joint Commission Journal on Quality Improvement.
These literature searches and on-line screening for relevancy retrieved over 2000 additional articles, which were added to the project database. These articles were used for evaluations of individual indicators. Those articles cited are listed in the references.
The use of medical literature databases likely eliminated much of the "gray literature" that may be applicable to this study. Given the limitations and scope of this study, we did not complete a formal search of the "gray literature" beyond that which was previously known by the project team, or resulted from our telephone interviews.
Step 3. Selection of a sub-set of indicators
Since there were too many indicators identified in Phase 1 (literature search and parallel steps) for detailed evaluation using the Evaluation Framework, we developed criteria to select a group for further evaluation. These criteria were intended to be top level evaluations of the face validity and precision of the indicators. We first selected a subset of indicators for preliminary empirical evaluation. To do this, first, the indicators related to complications were disqualified for this particular report since they will be included in an expansion to the report that will include patient safety indicators. Second, all of the current HCUP I indicators (except those related to complications of care) were selected for empirical evaluation. Third, we lowered the priority of clinical areas well covered by the current HCUP I indicator set, for example obstetrical indicators. Finally, a set of criteria for selection was applied to the remaining indicators.
The following were specific criteria for evaluation for all indicators:
- Indicator must be definable with HCUP data (i.e. uses only administrative data available in HCUP data set)
- Conditions that affect at least 1% of hospitalized patients and/or 20% of providers, as tested using the Nationwide Inpatient Sample Dataset
- Conditions that are the subject of public reporting, previous use or large dollar volume
- Clear relationship to quality apparent as evaluated by clinical judgement of health services researchers and medical doctors
In addition several specific criteria were noted for the indicator types:
- Volume:
- Widely documented volume-outcome relationship
- Recent evidence regarding volume-outcome relationship
- Utilization rates:
- Condition must have an alternative surgical or medical therapy with lower/higher morbidity and/or mortality
- Ambulatory care sensitive conditions:
- Differences in patient management practices for that condition
- Existence of treatment guidelines, and evidence of failure to comply
- In-hospital mortality
- Relatively homogenous group
When selecting between competing alternatives that met all the above criteria, we chose to evaluate clinical areas in depth rather than evaluating a large breadth of indicators. To do this we evaluated multiple aspects in one clinical domain (i.e., evaluations of CABG, PTCA, and AMI; stroke and carotid endarterectomy). In these clinical areas we evaluated at least two different types of indicators (i.e. mortality and utilization). The reasons for selection or elimination for each indicator are listed in Appendix 5.
The selected indicators were then evaluated empirically, using preliminary tests of precision. Those demonstrating adequate precision were then evaluated by a literature review (Phase 2), as well as further empirical analysis.
Step 4. Evidence evaluation
The abstracts from relevant articles for each indicator were reviewed and selected according to the following criteria:
- The article addressed some aspect of the six areas of indicator performance.
- The article was relevant to a national sample, rather than a local population.
Based on this literature, a team member or clinician developed a draft write-up of the indicator following the evaluation framework (See Section 2.B. for a description of the evaluation framework).
2.D. Risk Adjustment of HCUP Quality Indicators
Overview. "Raw" unadjusted measures of hospital or area performance for each indicator are simple means constructed from the HCUP discharge data and census population counts. Obviously, simple means do not account for differences in the indicators that are attributable to differences in patient mix across hospitals that are measured in the discharge data, or demographic differences across areas. In general, risk adjustment involves conducting a multivariate regression to adjust expected performance for these measured patient and population characteristics. Although complex, multivariate regression methods are the standard technique for risk-adjustment because they permit the simultaneous consideration of multiple patient characteristics, and interaction among those characteristics. The interpretation of the risk-adjusted estimate is straightforward: it is the value of the indicator expected at that hospital if the hospital had an `average' patient case-mix.
This section contains the methods for our evaluation of risk adjustment systems, leading to our decision to use APR-DRGs. The purpose of this evaluation is to briefly outline the evidence regarding the use of risk adjustment systems for both evaluating potential bias in indicators, and for risk adjusting established indicators to compare provider performance. The first section discusses criteria used to evaluate the risk adjustment systems. Such criteria arise from both the literature-based evidence on risk adjustment systems, as well as user criteria obtained through the semi-structured telephone interviews. Second, we outline the methods used to implement APR-DRGs empirically in the HCUP II QI set. We describe our methods for risk-adjustment of the hospital level quality indicators. An analogous method was used for the area level quality indicators. However, in our area level indicators we account only for demographic differences.
Risk Adjustment Literature Review Methods
Our literature review for risk adjustment of the HCUP Quality Indicators combined evaluation criteria common to evidence studies on the performance of risk adjustment systems with additional considerations of importance to the potential HCUP users. These considerations were determined through semi-structured interviews with users, discussed earlier in this report. In general, users viewed risk adjustment as an important component of the HCUP QIs refinement. State data organizations and agencies involved in reporting of hospital performance measures especially tended to view risk-adjustment as essential for the validity of the results and acceptance by participating hospitals. Concerns that patient severity differed systematically among providers, and that this difference might drive the performance results, was frequently mentioned as a reason for limited reporting and public release of the HCUP I QIs to date, especially for outcome-oriented measures like mortality following common elective procedures.
Literature-Based Criteria for Evaluating Risk Adjustment Systems
HCUP I users were concerned about the validity or performance of possible risk adjustment systems. We assessed evidence on the performance of risk-adjustment systems from published reports using the following commonly applied criteria.15, 16, 182
- Classification and analytic approach. Risk adjustment systems have been developed to predict complications, resource use, and mortality. Alternative analytic approaches included stratification (assigning individuals to mutually exclusive cells), logistic regression, or linear regression (calculating an expected level of medical utilization based on a statistical model). Methods based on logistic or linear statistical models are generally able to consider more dimensions of patient characteristics than stratification. Even more effective approaches might involve combining multivariate adjustment and stratification through propensity score methods 183 and accounting for the relationship between aspects of disease severity that are measured and those that are not. 184 However, no currently available risk adjustment systems are based on these analytic methods.
- System development method. Risk adjustment classifications may be based either on an empirical model clinical judgment, or some combination. For example, an assessment of whether two heart attack patients are expected to have similar outcomes can be based on statistical tests or clinical expertise or both. 15
- Feasibility. Feasibility is largely determined by the data requirements of the risk-adjustment method. We reviewed whether a system required hospital data elements other than those found on the discharge abstract (e.g., data from medical charts or laboratory data) or non-hospital data (e.g., outpatient hospital or physician data). We also evaluated whether the method was likely to be enhanced with discharge data that included a unique patient identifier, so that risk adjusters could be developed based on data from multiple hospitalizations or encounters. Because only a subset of the states participating in HCUP collect supplementary data beyond discharge abstracts and/or unique patient identifiers for use in longitudinal analyses, we did not select a risk adjustment system that depended on such information.
- Empirical performance: discrimination. A critical aspect of the performance of a risk-adjustment model is the extent to which the model predicts a higher probability of an event for patients who actually experience the event. The statistical test of discrimination is generally expressed as a C-statistic or R2 (how much of the variation in the patient level data the model explains). In general, systems that discriminate more have the potential to influence QI measures more substantially. Many severity-adjustment systems were designed primarily to predict in subsequent periods (e.g. resource consumption next year). However, for purposes of evaluating QI performance, the estimation of concurrent risk is more important (i.e., differences in the likelihood of experiencing an outcome in the current time period). Ideally, discrimination would be assessed using an R2 or other statistic of predicted variation that is computed on a separate data sourcefrom the one used to develop the model, to avoid `over-fitting' (i.e., the model might appear do well in part because it explains nonsystematic variations in the data used to develop it).
- Empirical performance: calibration. Calibration is a measure of whether the mean of the predicted outcomes equals the mean of the actual outcomes for the entire population and for population subgroups. The statistical test is often expressed as a Chi-square or `goodness-of-fit' for the equivalence of means of population subgroups. Even if the severity-adjustment system does not predict well at the level of individuals, it may predict well at the aggregate (group) level of, say, women, 70-74 years of age. Over-fitting will be an issue here as well, unless a different data source is used to validate the model than was used to estimate the model.
Not many risk-adjustment systems have been evaluated in published reports using all of these criteria, nor have they been evaluated using consistent data sources. These limitations of the literature on risk adjustment complicate comparisons of risk adjustment systems based on performance criteria. In the end, the user specified criteria determined a narrow set of potential risk adjustment systems to consider. The performance criteria delineated between these potential systems, and informed our own empirical evaluation of the impact of risk adjustment on the assessment of provider and area quality.
User-Specified Criteria for Evaluating Risk Adjustment Systems
Evidence on the performance of a risk adjustment system is a primary consideration for HCUP users, and is essential to the validity of reported performance measures. However, users also cited other factors as potentially important determinants of the acceptance of HCUP QIs reporting by hospitals, state regulators and state legislatures, and other potential consumers of hospital performance data. These factors included the following:
- "Open" systems preferable to "black box" systems. Although there was no specific prohibition against using proprietary systems vs. systems in the public domain, there was a preference for using "open" systems where the risk adjustment logic was published and available for scrutiny by interested parties.
- Data collection costs minimized, and well-justified. The widespread recognition that data collection was costly for hospitals meant that any risk-adjustment system that would be imposed on hospitals had to justify the cost of data collection, by documenting that the additional information led to substantially different and more accurate inferences about performance. At least one state had stopped using a risk adjustment system that required medical chart review because the high cost of implementation was not considered worth the efficiency gained from improved accuracy.
- Multiple-use coding system. Some risk adjustment systems were designed to categorize patients according to expected resource use, defined either as charges or length of stay, while others were designed to categorize patients according to expected health outcomes, including mortality and complications. For example, several states calculated and reported mortality rates by diagnosis-related group (DRG). These users generally believed that a risk-adjustment system for health outcomes based on discharge records that relied on the same diagnostic groups used for reimbursement was more likely to be accurate than a system that relied on codes used for quality and health outcome comparisons only, since there would be less financial and audit incentives to record codes accurately for the latter. Thus, coding systems that affected reimbursement for at least some patients were likely to capture diagnoses and procedures reported in medical charts. One potentially important limitation of relying on codes that are also used for payment is that changes in reimbursement-related coding practices (e.g., as a result of tighter Medicare rules implemented in 1996) may alter apparent severity. However, because of the financial implications of changes in coding practices, any significant changes are likely to be identified and reported by payers, and so can be considered in interpreting variations and trends in reported quality measures.
- Official recognition. Many users indicated that systems that had been supported or otherwise recognized by government agencies such as AHRQ were preferable to other systems, because such support facilitated acceptance by legislative and hospital groups. Adoption of the HCUP I QIs themselves were often justified in part by their sponsorship by the AHRQ. State agencies, especially those from smaller states, often cited the lack of staff resources and expertise needed to make independent evaluations of competing indicator sets and risk adjustment methods.
Risk Adjustment Empirical Methods
We used the APR-DRG system, with severity and risk of mortality classifications, in two ways:
- to evaluate the impact of measured differences in patient severity on the relative performance of hospitals and areas, by comparing QI measures with and without risk adjustment; and
- to risk-adjust the hospital- and area-specific measures.
As our previous review noted, the available literature on the impact of risk adjustment on indicator performance is limited, but suggests that at least in some cases different systems may give different results. Problems of incomplete or inconsistent coding across institutions are probably important contributing factors to the differences in results. Thus, definitive risk adjustment for some indicators may require detailed reviews of medical charts and additional data sources (charts may also be incomplete), just as definitive quality measures for many indicators may require additional sources of information. However, the importance of random variations in patients means that whatever risk adjustment and quality measurement system is chosen should be used in conjunction with statistical methods that seek to minimize other sources of noise and bias. Our empirical analysis is intended to illustrate the approach of combining risk adjustment with smoothing techniques, including suggestive evidence on the importance of risk adjustment for potential HCUP II QIs, using a risk adjustment system that can be implemented on discharge data by most HCUP users. We also supplement our empirical analysis with a review of the clinical literature, to identify additional clinical information that is important to consider for certain indicators. In particular, our literature review highlights a few indicators where risk adjustment with additional clinical data has been shown to be particularly important, and where important differences in case mix seem less likely to be related to the secondary diagnoses used to risk-adjust discharge data.
This section describes how we implement risk-adjustment using patient demographics (age and sex) along with the APR-DRG classification system. The next section describes statistical methods we employ to account for additional sources of noise and bias not accounted for by observed patient characteristics. By applying these methods to all of the potential HCUP II QIs, we are able to evaluate the relative importance of both risk adjustment and smoothing in terms of the relative performance of hospitals (or areas) compared to the "raw" unadjusted QIs based on simple means from NIS discharge data. The simple means fail to account both for differences in the indicators that are attributable to systematic differences in measured and unmeasured patient mix across hospitals/areas that are measured in the discharge data, and for random variations in patient mix. We adopted a multivariate regression approach to adjust performance measures for measured differences in patient mix, which permits the inclusion of multiple patient demographic and severity characteristics.
Specifically, if we denote whether or not the event associated with a particular indicator Yk (k=1,…,K) was observed for a particular patient i at hospital/area j (j=1,…,J) in year t (t=1,…,T), then the regression to construct a risk-adjusted "raw" estimate a hospital/area's performance on each indicator can be written as:
(1)
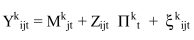 , where
Yk ijt is the kth quality indicator for patient i discharged from hospital/area j in year t (i.e., whether or not the event associated with the indicator occurred on that discharge);
Mk jt is the "raw" adjusted measure for indicator k for hospital/area j in year t (i.e., the hospital/area "fixed effect" in the patient-level regression);
Zijt is a vector of patient covariates for patient i discharged from hospital/area j in year t (i.e., the patient-level measures used as risk adjusters);
Πk t is a vector of parameters in each year t, giving the effect of each patient risk adjuster on indicator k (i.e., the magnitude of the risk adjustment associated with each patient measure); and
 k
ijt is the unexplained residual in this patient-level model.
k
ijt is the unexplained residual in this patient-level model.
The hospital/area specific intercept Mk jt is the "raw" adjusted measure of a hospital/area's performance on the indicator, holding patient covariates constant. In most of the empirical analysis that follows, the patient-level analysis is conducted using data from all hospital/areas. (The model shown implies that each hospital/area has data for all years, and within each year has data on all outcomes; however, this is not essential in order to apply risk adjustment methods.)
We estimated these patient-level regressions by linear ordinary least-squares (OLS). In general, the dependent variables in the regressions are dichotomous, which raises the question of whether a method for binary dependent variables such as logit or probit estimation might be more appropriate. However, previous work by McClellan and Staiger has successfully used OLS regression for similar analyses of hospital/area differences in outcomes. In addition, estimating logit or probit models with hospital/area fixed effects cannot be done with standard methods; it requires computationally intensive conditional maximum likelihood methods that are not easily extended to multiple years and multiple measures. 185 A commonly-used "solution" to this problem is to estimate a logit model without hospital/area effects, and then to use the resulting predictions as estimates of the expected outcome. However, this method yields biased estimates and predictions of hospital performance. In contrast, it is easy to incorporate hospital/area fixed effects into OLS regression analysis, the resulting estimates are not biased, and the hospital/area fixed effects provide direct and easily-interpretable estimates of the outcome rate for a particular hospital/area measure in a particular year, holding constant all observed patient characteristics.
Of course, it is possible that a linear probability model is not the correct functional form. However, as in our earlier work, we specified a very flexible functional form, including full interactions among age and sex covariates as well as a full set of APR-DRG risk adjusters. In our sensitivity analyses for selected quality measures, this flexible linear probability model produced estimates of the effects of the risk adjusters that did not differ substantially from nonlinear (logit and probit) models. Another potential limitation of the OLS approach is that it may yield biased estimates of confidence intervals, because the errors of a linear probability model are necessarily heteroskedastic. Given the large sample sizes for the parameters estimated from these regressions (most indicators involve thousands of "denominator" discharges per year), such efficiency is not likely to be an important concern. Nevertheless, we estimated models using Weighted Least Squares 186 to account for heteroskedasticity, to see if our estimates were affected. We obtained very similar estimates of adjusted indicator performance.
Specifically, in addition to age, sex, and age*sex interactions as adjusters in our model, we also included the APR-DRG category for the admission and the APR-DRG constructed severity subclass (or risk-of-mortality subclass for mortality measures). APR-DRGs are a refinement of the DRGs used by the Health Care Financing Administration, with additional classifications for non-Medicare cases (e.g., neonates). The severity subclass evaluates the episode of care on a scale of 1 (minor) to 4 (extreme). In the APR-DRG Version 12, Severity of Illness is defined as the "extent of physiologic de-compensation or organ system loss of function." The APR-DRG severity of illness subclass was designed principally to predict resource use, particularly length-of-stay. As such, because this risk-adjustment system was not designed to predict utilization rates, for example, in our evaluation of each indicator we do not consider lack of impact of risk-adjustment to be evidence of lack of real bias. However, we do consider impact of risk-adjustment to be evidence of problems of potential bias. The literature review further informs us to potential sources of bias, and the prior use of each indicator may require collection of supplemental data for confounding clinical conditions. We discuss these issues further in the Results Chapter.
For each indicator, we excluded from our risk adjustment model the APR-DRG groupings in the Major Diagnostic Category (MDC) related to that indicator. The groupings are either medical (based on diagnoses) or surgical (based on procedures), and we excluded groupings in the MDC of the same type. For example, for the Coronary Artery Bypass Graft rate indicator, we excluded all surgical APR-DRGs in MDC `05' (`Diseases and Disorders of the Circulatory System'). For GI Hemorrhage mortality, we excluded all medical APR-DRGs in MDC `06' (`Diseases and Disorders of the Digestive System'). Some of the indicators fall into only a few DRG categories. All discharges with carotid endarterectomy, for example, were within DRG `005', (`Extracranial Vascular Procedures'). For these indicators, we relied primarily on the severity subclass, which is independent of the DRG.
Actual implementation of the model involves running a regression with potentially a few thousand variables (each DRG divided into four severity subclasses) on millions of observations, straining the capacity of most statistical software and computer systems. In order to limit the number of covariates (DRG groups) in the model, we restricted the total number to 165 categories (DRG by severity), which was for all indicators sufficient to include 80% of discharges. We maintained all severity or risk-of-mortality subgroups for each APR-DRG included in the model in our construction of the raw adjusted estimates. The adjusted estimates of hospital performance are reported and used to compute descriptive statistics for each indicator in each year, as noted below. They are also used to construct smoothed estimates of each indicator.
The risk-adjusted estimates of hospital performance (age, gender, APR-DRG) and area performance (age, gender only) were used to construct descriptive statistics and smoothed estimates for each QI, as described in the next section.
2.E. Empirical Methods
Analysis Approach
Data sources
The data sources used in the empirical evaluation were the 1995-97 Nationwide Inpatient Sample (NIS), which has been used for previous HCUP development, and the complete State Inpatient Data (SID) for 5 HCUP participating states (California, Florida, Illinois, New York, and Pennsylvania). The annual NIS consists of about 6,000,000 discharges and over 900 hospitals. The HCUP Nationwide Inpatient Sample contains all-payer data on hospital inpatient stays from selected States (Arizona, California, Colorado, Connecticut, Florida, Illinois, Iowa, Kansas, Maryland, Massachusetts, Missouri, New Jersey, New York, Oregon, Pennsylvania, South Carolina, Tennessee, Washington, Wisconsin, and starting in 1997, Georgia, Hawaii, and Utah). All discharges from sampled hospitals are included in the NIS database. The NIS is designed to approximate a 20-percent sample of U.S. community hospitals, defined as all nonfederal, short-term, general, and other specialty hospitals, excluding hospital units of institutions. Included among community hospitals are specialty hospitals such as obstetrics-gynecology, ear-nose-throat, short-term rehabilitation, orthopedic, and pediatric. Excluded are long-term hospitals, psychiatric hospitals, and alcoholism/chemical dependency treatment facilities. A complete description of the content of the NIS, including details of the participating States discharge abstracts, can be found on the Agency for Healthcare Research and Quality web site (www.ahrq.gov/data/hcup/hcupnis.htm). The SID sample consisted of 10,000,000 discharges and over 1300 hospitals, in over 200 metropolitan areas. Only the SID empirical results are reported because the provider level results were similar in both data sources, and the SID data was needed for the direct construction of area measures. All of the quality indicators can be constructed from the Nationwide Inpatient Sample, with two caveats: first, the area measures are based on a weighted sample of discharges, and are less precise than if complete state discharge data are used, and second, even though hospital sampling for the NIS was supposed to allow construction of a representative sample at the state level, it is possible that the Metropolitan Service Area (MSA)-level samples are not representative (i.e. biased). These limitations are not applicable when using the software on the full data from the SID to construct measures based on complete data from area hospitals.
Reported quality indicators
All potential indicators were assessed empirically by developing and conducting statistical tests for evaluation framework criteria of precision, bias, and construct validity. For each statistical test, we calculated up to four different estimates of indicator performance. First, the raw indicator was the simple observed value (e.g., the rate or volume) for each provider or area. Second, the adjusted indicator was based on the use of multi-variate regression to account for differences among providers in demographics and co-morbidities (defined using the 3M All-Patient Refined DRG, or APR-DRG) of patients, and among areas in demographics of the population. Third, we applied univariate smoothing techniques 86 to estimate the amount of random error relative to the true difference in performance (the `reliability') for each indicator. Fourth, we applied new multi-variate signal extraction methods 187 by combining information from multiple indicators over several years in order to extract more quality signal from each individual indicator than is possible with the univariate methods.
Overview of empirical analysis
Our approach included several stages, and generated a series of analyses on potential quality indicators that sequentially assessed some of the problems identified in our literature review. For reference, we began by constructing the "raw" or minimally adjusted indicator, based on the discharge data for each hospital and census data for each area. We then "risk-adjusted" this measure through a discharge-level regression that included controls for patient mix. The hospital-level and area-level fixed effects in these regressions are the estimates of quality indicators that are typically reported for particular hospitals and areas, and they typically reflect substantial noise. In the second stage of the analysis, we then "smoothed" these estimates using a Bayesian procedure to yield a best-guess estimate of true hospital or area performance on the indicator - the "signal" in the observed noisy measure. We did this in two ways. First, we used a univariate approach, in which the distribution of the indicator itself is used to construct the best guess. This is the smoothing or shrinkage approach most widely used in the literature on provider quality.87-89 Second, we used a multivariate approach, in which the joint distribution of a large number of indicators (and the indicator of interest in previous time periods) is used to construct the best-guess estimate of performance. In general, the covariation among different indicators and within each indicator over time implies that we can generate much more precise estimates of true hospital or area quality using this multivariate signal extraction approach. All of our estimates of factor loadings and correlations are based on smoothed estimates, which helps to improve our ability to detect correlations, thereby addressing the multidimensionality of quality. Finally, we also report summary statistics describing the performance of the indicator in terms of the principal domains described in our literature review: precision, bias, and construct validity.
Intuition Behind Univariate and Multi-variate Methods
An important limitation of many quality indicators is their imprecision, which complicates the reliable identification of persistent differences among providers in performance. The imprecision in quality indicators arises from two sources. The first is sampling variation, which is a particular problem for indicators based on small numbers of patients per provider (where the particular patients treated by the provider in a given year are considered a `sample' of the entire population who might have been treated or will be treated in the near future). The amount of variation due to the particular sample of patients is often large relative to the total amount of provider level variation that is observed in any given quality indicator. A second source of imprecision arises from non-persistent factors that are not sensitive to the size of the sample; for example, a severe winter results in higher than usual rates of pneumonia mortality. Both small samples and other one-time factors that are not sensitive to sample size can add considerable volatility to quality indicators. Also, it is not the absolute amount of imprecision that matters, but rather the amount of imprecision relative to the underlying signal (i.e., true provider level variation) that dictates the reliability of any particular indicator. Even indicators based on relatively large samples with no non-persistent factors at work can be imprecise if the true level of variation among providers is negligible.
Our approach to account for the imprecision or lack of reliability is a generalization of the idea of applying a "shrinkage factor" to each provider's estimate so that less reliable estimates are shrunk toward the national average. These `reliability-adjusted' estimates are sometimes referred to as `smoothed' estimates (because provider performance is less volatile over time) or `filtered' estimates (because the methods filter out the non-systematic noise, much like a radio filters our background noise to improve the radio signal). If the observed provider variation = signal variation + noise variation, then the shrinkage factor would be signal variation / (signal variation + noise variation). For example, suppose that the observed variation among providers in the in-hospital pneumonia mortality rate was a standard deviation of 10.2 percentage points, and the signal variation was a standard deviation of 5.0 percentage points. Then the shrinkage factor for this indicator is 0.240 = (0.050^2) / (0.102^2). The generalization of this approach seeks to extract additional signal using information on the relationship among multiple indicators over time.
Many of the key ideas behind the reliability-adjusted or filtered estimates are illustrated through a simple example. Suppose that one wants to evaluate a particular provider's performance based on in-hospital mortality rates among patients admitted with pneumonia, and data is available for the most recent two years. Consider the following three possible approaches: (1) use only the most recent mortality rate, (2) construct a simple average of the mortality rates from the two recent years, or (3) ignore the provider's mortality rate and assume that mortality is equal to the national average. The best choice among these three approaches depends on two important considerations: the signal-to-noise ratio in the provider's data, and how strongly correlated performance is from one year to the next. For example, suppose that the mortality rate for the provider was based on only a few patients, and one had reason to believe that mortality did not vary much across providers. Thenone would be tempted to choose the last option and ignore the provider's own data because of its low reliability (e.g. low signal-to-noise ratio). This is the idea of simple shrinkage estimators, in which less reliable estimates are shrunk toward the average for all providers. Alternatively, if one had reason to believe that provider mortality changed very slowly over time, one might choose the second option in hopes that averaging the data over two years would reduce the noise in the estimates by effectively increasing the sample size in the provider. Even with large numbers of patients one might want to average over years if idiosyncratic factors (such as a bad winter) affected mortality rates from any single year. Finally, one would tend to choose the first option, and rely solely on mortality from the most recent year, if such idiosyncratic factors were unimportant, if the provider admitted a large number of patients each year, and if mortality was likely to have changed from the previous year.
Our method of creating filtered estimates formalizes the intuition from this simple example. The filtered estimates are a combination of the provider's own quality indicator, the national average, and the provider's quality indicators from past years or other patient outcomes. As suggested by the example, to form the optimal combination one must know the amount of noise and signal variance in each indicator, as well as the correlation across indicators in the noise and signal variance. We estimate the noise variance (and covariance) in a straightforward manner for each provider, based on the number of patients on which each indicator is based. To estimate the signal variance (and covariance) for each quality indicator, we subtract the noise variance from the total variance observed in each indicator across providers (which reflects both signal and noise variance). In other words, the observed variation in quality indicators is sure to overstate the amount of actual variation across providers (because of the noise in the indicators). Therefore, we estimate the amount of true variation in performance based on how much the observed variation exceeded what would have been expected due to sampling error. Importantly, our method does not assume that provider performance is correlated from one year to the next (or that performance is correlated across indicators). Instead, we estimate these correlations directly from the data, and incorporate information from past years or other indicators only to the extent that these empirically estimated correlations are large.
Smoothed Estimates of Hospital Performance
For each hospital, we observed a vector of K adjusted indicator estimates over T years from estimating the patient-level regressions (1) run separately by year for each indicator as described in the preceding section. We know that each indicator is a noisy estimate of true hospital quality; in other words, it is likely that hospitals that performed especially well or badly on the measure did so at least in part due to chance. This fact is incorporated in Bayesian methods for constructing best-guess "posterior" estimates of true provider performance based on observed performance and the within-provider noise in the measures.
In particular, let Mj be the 1xTK vector of estimated indicator performance for hospital j. Then:
(2)
Mj=μj +
j
Where μj is a 1xTK vector of the true hospital intercepts for
hospital j, and
j is the estimation error (which has a mean zero and is
uncorrelated with μj). Note that the variance of
j can be estimated from the patient-level regressions, since
this is simply the variance of the regression estimates Mj.
In particular, E(
jt'
jt) = Ωjt and E(
jt'
js) = 0 for t ≠ s, where Ωjt is the covariance
matrix of the intercept estimates for hospital j in year t.
We wish to create a linear combination of each hospital's observed indicators in such a way that it minimizes the mean-squared prediction error. In other words, we would like to run the following hypothetical regression:
(3) μk jt=Mjβk jt + vk jt
but cannot do this directly, since μ is unobserved and the optimal β varies by hospital and year. While we cannot directly estimate equation (3), it is possible to estimate the parameters for this hypothetical regression. In general, the minimum mean squared error linear predictor of μ is given by Mj β, where β = [E(Mj'Mj)]−1 E(Mj'μj). This best linear predictor depends on two moment matrices:
(4.1)
E(Mj'Mj=E(μj' μj) +
E(
j'
j)
(4.2) E(Mj'μj=E(μj' μj)
We estimate the required moment matrices directly as follows:
- Estimate E(
j'
j) with the patient-level OLS estimate of the
covariance matrix for the parameter estimates Mj.
Call this estimate Sj. Note that Sj
varies across hospitals.
- Estimate E(μj' μj) by noting that E(Mj'Mj - Sj) = E(μj' μj). If we assume that E(μj' μj) is the same for all hospitals, then it can be estimated by the sample average of Mj'Mj - Sj. Note that it is easy to relax the assumption that E(μj' μj) is the same for all hospitals by calculating Mj'Mj - Sj for subgroups of hospitals.
With estimates of E(μj' μj) and E(
j'
j), one can form least squares estimates of the parameters in
equation 3 which minimize the
mean squared error. Analogous to simple regression, the prediction of a
hospital's true intercepts is given by:
(5)
 =
MjE(M'j Mj)-1
E(M'jμj) =
Mj[E(μ'jμj) + E
(jj)]-1
E(μ'jμj)
=
MjE(M'j Mj)-1
E(M'jμj) =
Mj[E(μ'jμj) + E
(jj)]-1
E(μ'jμj)
using estimates of E(μj' μj) and E(
j'
j) in place of their true values. One can use the estimated
moments to calculate other statistics of interest as well, such as the
standard error of the prediction and the r-squared for
equation 3, based on the usual
least squares formulas. We refer to estimates based on
equation (5) as "filtered"
estimates, since the key advantage of such estimates is that they
optimally filter out the estimation error in the raw quality indicators.
Equation 5 in combination with estimates of the required moment matrices provides the basis for estimates of hospital quality. Such estimates of hospital quality have a number of attractive properties. First, they incorporate information in a systematic way from many outcome indicators and many years into the predictions of any one outcome. Moreover, if the moment matrices were known, our estimates of hospital quality represent the optimal linear predictors, based on a mean squared error criterion. Finally, these estimates maintain many of the attractive aspects of existing Bayesian approaches 87 , while dramatically simplifying the complexity of the estimation. It is possible to construct univariate smoothed estimates of hospital quality, based only on empirical estimates for particular measures, using the models just described but restricting the dimension of Mj to only a particular indicator k and time period t. Of course, to the extent that the provider indicators are correlated with each other and over time, this will result in a less precise (efficient) estimate.
With many years of data, it helps to impose some structure on E(μj'μj) for two reasons. First, this improves the precision of the estimated moments by limiting the number of parameters that need to be estimated. Second, a time series structure allows for out-of-sample forecasts. We use a non-stationary, first-order Vector Autoregression structure (VAR). The VAR model is a generalization of the usual autoregressive model, and assumes that each hospital's quality indicators in a given year depend on the hospital's quality indicators in past years plus a contemporaneous shock that may be correlated across quality indicators. In most of what follows, we assume a non-stationary first-order VAR for mjt (1xK), where:
(6)

Thus, we need estimates of the lag coefficient (Φ), the variance matrix of the innovations (Σ), and the initial variance condition (Σ), where Σ and Γ are symmetric KxK matrices of parameters and Φ is a general KxK matrix of parameters, for a total of 2K2+K parameters. For example, we must estimate 10 parameters for a VAR model with two outcomes (K=2).
The VAR structure implies that E(Mj'Mj -
Sj) = E(mj'mj) = f(Φ,Σ,Γ). Thus, the
VAR parameters can be estimated by Optimal Minimum Distance (OMD) methods,
185
i.e. by choosing the VAR parameters so that the theoretical
moment matrix, f(Φ,Σ,Γ), is as close as possible to the corresponding
sample moments from the sample average of Mj'Mj -
Sj. More specifically, let dj be a vector of
the non-redundant (lower triangular) elements of
Mj'Mj - Sj, and let δ be a vector of
the corresponding moments from the true moment matrix, so that
δ=g(Φ,Σ,Γ). Then the OMD estimates of (Φ,Σ,Γ) minimize the following OMD
objective function:
(7)
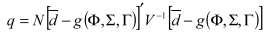
where V is
the sample estimate of the covariance matrix for d, and  is the sample average of d. If the VAR model is
correct, the value of the objective function, q, will be distributed
χ2 (p) where p is the degree of over-identification (the
difference between the number of elements in d and the number of
parameters being estimated). Thus, q provides a goodness of fit
statistic that indicates how well the VAR model fits the actual
covariances in the data.
is the sample average of d. If the VAR model is
correct, the value of the objective function, q, will be distributed
χ2 (p) where p is the degree of over-identification (the
difference between the number of elements in d and the number of
parameters being estimated). Thus, q provides a goodness of fit
statistic that indicates how well the VAR model fits the actual
covariances in the data.
Finally, we use estimated R2 statistics to evaluate the
filtered estimates' ability to predict (in sample) and forecast
(out-of-sample) variation in the true intercepts, and to compare our
methods to conventional methods (e.g. simple averages, or univariate
shrinkage estimators). If true hospital intercepts (μ) were observed, a
natural metric for evaluating the predictions would be the sample r- squared:
(8)
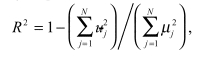
where
= μj -
is the prediction
error. Of course μ is not observed. Therefore, we construct an estimate
using our estimate of E(μj' μj) for the
denominator, and our estimate of E[(μj - )'(μj - )] for the terms in the numerator (where this
can be constructed from the estimated moment matrices in equations
4.1-4.2).
Finally, we report a weighted R-squared (weighting by the number of
patients treated by each hospital).
As in earlier work using this method for cardiac care in the adult
population, we validate our indicators using out-of-sample performance,
based on forecasts (e.g., using the first two years of data to predict
in subsequent year) and based on split-sample prediction (e.g., using
one half of the patient sample to predict outcome indicators in the
other half of the sample). For evaluating out-of-sample forecasts, we
construct a modified R-squared of the forecast that estimates the
fraction of the systematic (true) hospital variation in
the outcome measure (M) that was explained:
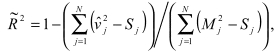
where  = Mj -
is the
forecast error, and Sj is the OLS estimate of the variance of
the estimate Mj. This modified R-squared estimates the amount
of variance in the true hospital effects that has been forecasted. Note
that because these are out-of-sample forecasts, the R-squared can be
negative indicating that the forecast performed worse than a naive
forecast in which one assumed that quality was equal to the national
average at all hospitals.
= Mj -
is the
forecast error, and Sj is the OLS estimate of the variance of
the estimate Mj. This modified R-squared estimates the amount
of variance in the true hospital effects that has been forecasted. Note
that because these are out-of-sample forecasts, the R-squared can be
negative indicating that the forecast performed worse than a naive
forecast in which one assumed that quality was equal to the national
average at all hospitals.
Empirical Analysis Statistics
Using the methods just described, we constructed a set of statistical tests to evaluate precision, bias, and construct validity. Each of the key statistical test results for these evaluation criteria was summarized and explained in the overview section of this chapter. Tables 1-3 provides a summary of the statistical analyses and their interpretation. Indicators were tested for precision first, and ones that performed poorly were eliminated from further consideration. These indicators are noted in Appendix 5. We assessed bias and construct validity for all recommended indicators. Cut-offs and further interpretation details are provided with results tables.
Table
Table 1. Precision Tests.
Table
Table 2. Bias Tests.
Table
Table 3. Construct Validity Tests.
Footnotes
- 1
Random chance as used in this document refers to unsystematic unobservable factors that influence QI performance. Most accurately these factors are neither entirely random nor due to chance, however, statistically they represent the unmeasurable and unsystematic differences that are most likely not due to actual quality differences.
- 2
The PPV represents that the chance that a positive test result reflects a "true positive." It combines the properties of the test itself (e.g., sensitivity and specificity for detecting quality problems) with the prevalence of true quality problems in the target population.
- 3
We chose not to search EMBASE 181 on the grounds that the studies of quality measurement necessarily must take into account the particular health care system involved.
- Methods - Refinement of the HCUP Quality IndicatorsMethods - Refinement of the HCUP Quality Indicators
Your browsing activity is empty.
Activity recording is turned off.
See more...